


Most feed budgets fall apart the same way. You take total headcount, multiply by a rough per-head intake figure, tack on a percentage for waste, and call it a plan. Then October hits, your fall-born calves are still nursing while your yearlings are stacking on winter weight, a cold snap spikes maintenance requirements across the board, and suddenly your monthly feed spend is 22% over what the spreadsheet said.
The gap isn't bad math. It's that a single blended intake number pretends every animal in the herd has the same nutritional demand at the same time. They don't. A dry cow in mid-gestation, a lactating dam, a growing weaner, and a finishing steer can differ by more than double in what they pull off the ration each day — and those differences shift by season and by lifecycle event. This is a walkthrough of how to build a feed budget by livestock life stages that actually holds up, using a step-through calculation you can drop into a spreadsheet, plus the adjustment rules for weather and lifecycle events that most budgets skip entirely.
Why the blended-average method quietly overspends you
When you budget off one average intake figure, you're essentially averaging out the peaks. But feed cost doesn't respond to averages — it responds to actual daily demand, which is lumpy. Lactation peaks, cold-weather maintenance bumps, and growth phases don't cancel each other out on a calendar. They often stack in the same months.
A typical example: a spring-calving cow-calf operation runs its heaviest lactation demand in April through June, right as pasture is supposedly carrying the load. But if spring green-up runs three weeks late — which happens more than anyone budgets for — you're supplementing peak-lactation cows on pasture that hasn't caught up yet. The blended average never saw that coming because it smoothed the peak into the annual mean months earlier. Operations that budget on blended averages tend to be roughly accurate across a full year but wildly off month to month. And month-to-month is where cashflow lives.
The step-through method: build the budget from the animal up
The fix is to stop budgeting the herd and start budgeting cohorts. A cohort is a group of animals sharing the same life stage and rough body weight during a given period. You calculate feed for each cohort, per month, then sum. Work through this calculation sequence once and it becomes mechanical.
Simplify farm operations and enhance animal care.
Barnyly helps you organize, track, and manage every aspect of your farm operations seamlessly.
- Comprehensive livestock tracking
- Automated health alerts
- Feed and resource scheduling
No credit card required
-
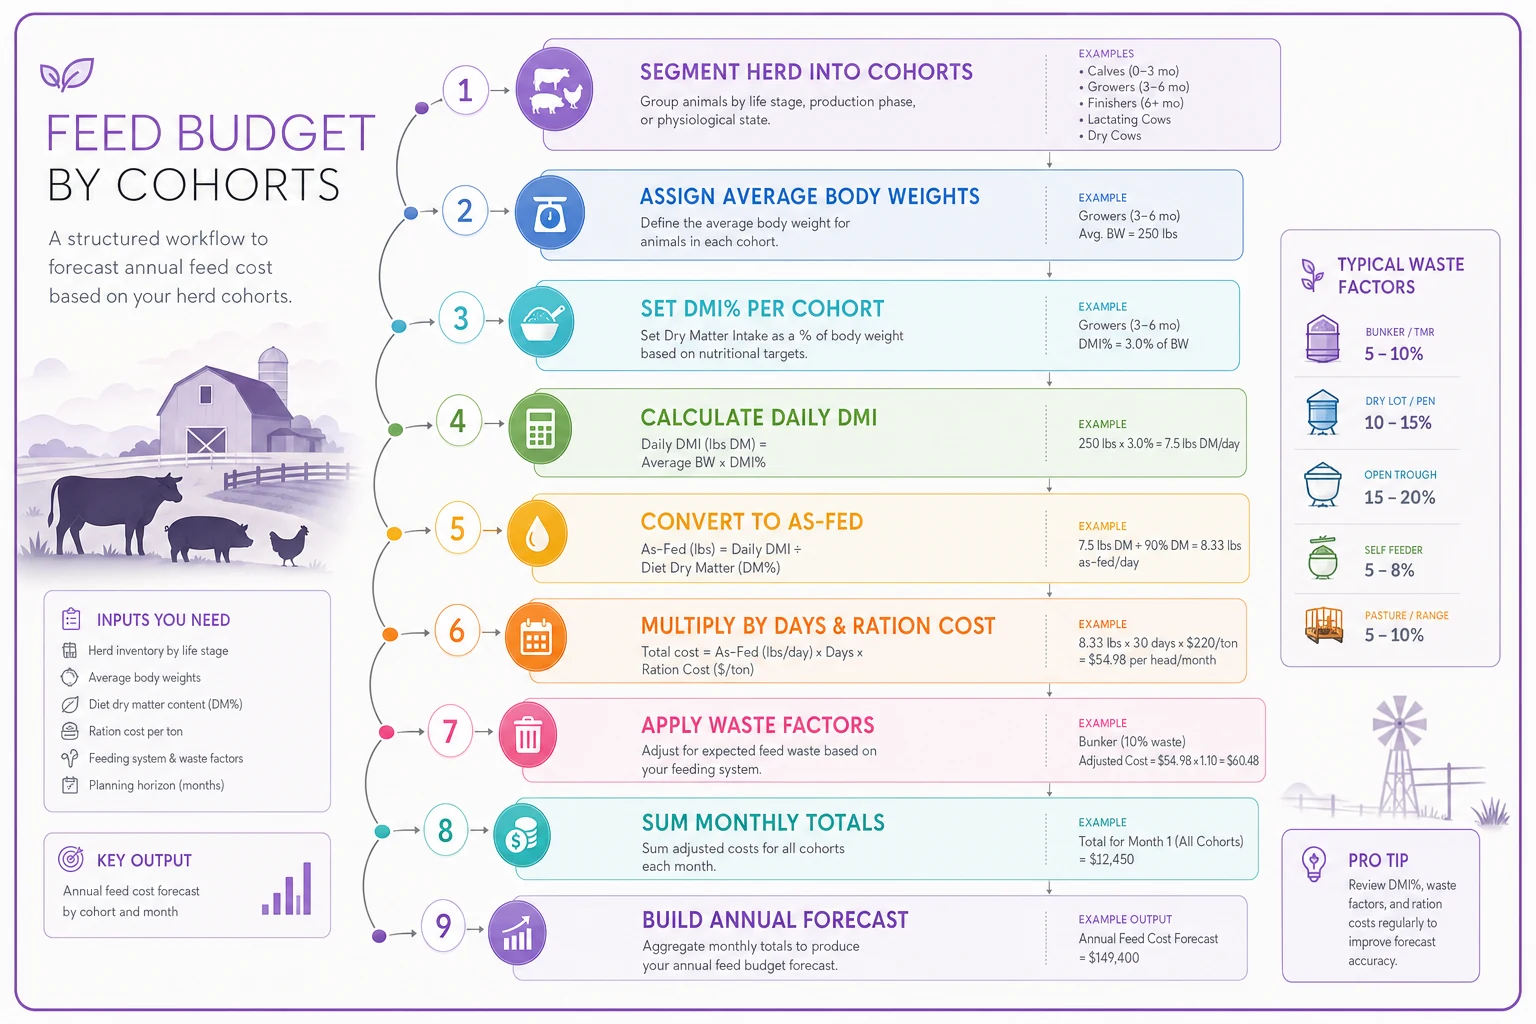
Segment the herd into life-stage cohorts. Not by age — by nutritional stage. For a beef operation that usually means: dry/maintenance cows, gestating cows (late third trimester separated out), lactating cows, replacement heifers, growing weaners, and finishing stock. Sheep and goats break down similarly — maintenance, late gestation, lactation, and growing lambs or kids.
-
Assign an average body weight to each cohort for the month you're calculating. Weight drives intake, so a cohort's number moves as the animals grow.
-
Set a dry matter intake (DMI) rate as a percentage of body weight. Maintenance sits around 1.8–2.0% of body weight in dry matter. Late gestation nudges toward 2.0–2.2%. Peak lactation can run 2.5–3.0%. Growing stock on gain sit around 2.5–2.7%. These are starting anchors — adjust to your own ration and monitored intake.
-
Calculate daily DMI per cohort average body weight × DMI% = daily dry matter per head. Multiply by head count in the cohort.
-
Convert dry matter to as-fed. If your feed is 88% dry matter, divide the DMI figure by 0.88 to get the actual poundage you'll physically move.
-
Multiply by days in the month, then by cost per pound of the ration each cohort is on. Different cohorts often eat different rations — don't blend the price either.
-
Add a waste factor per feeding system, not a flat farm-wide number. Bale rings waste differently than bunk feeding. More on that below.
-
Sum all cohorts for the monthly total, then across months for the annual figure.
That's the spine. Everything else is adjustment layered on top.
Here’s a visual of the calculation workflow.
That's the spine. Everything else is adjustment layered on top.
A worked example with numbers
Take a mid-sized spring-calving operation in December — deep winter, cows in late gestation, last year's weaners growing out.
| Cohort | Head | Avg BW (lb) | DMI % | Daily DM/head (lb) | Ration | As-fed cost/lb |
|---|---|---|---|---|---|---|
| Gestating cows (3rd tri) | 84 | 1,250 | 2.1% | 26.3 | Hay + supplement | $0.072 |
| Dry/maintenance cows | 22 | 1,200 | 1.9% | 22.8 | Hay | $0.061 |
| Replacement heifers | 18 | 800 | 2.4% | 19.2 | Hay + grain | $0.089 |
| Growing weaners | 46 | 560 | 2.6% | 14.6 | Grower ration | $0.104 |
Run the gestating cow line: 26.3 lb DM ÷ 0.88 DM content = roughly 29.9 lb as-fed. × 84 head = roughly 2,512 lb/day. × 31 days = roughly 77,870 lb. × $0.072 = around $5,610 for that cohort in December.
Do the same for the other three cohorts and December lands somewhere around $11,800–$12,400 depending on your waste factor. The point isn't the exact figure — it's that the gestating cows and the growing weaners, two cohorts you'd never dream of averaging together, each drive a distinct chunk of spend that moves independently month to month. Run this across all twelve months and you've got a cost-forecasting template that reflects what's actually happening instead of a smoothed annual guess.
Spreadsheet layout that doesn't turn into chaos
The mistake most people make is building one giant sheet and losing track of what feeds into what. Split it into three tabs:
-
Tab 1 — Cohort inputs. One row per cohort, columns for head count, body weight, DMI%, ration assignment, and feeding system. This is the only place you edit assumptions.
-
Tab 2 — Monthly calculation grid. Cohorts down the side, months across the top. Cells pull body weight and DMI from Tab 1 and run the as-fed calculation. Body weight for growing cohorts should increment month to month at your expected gain.
-
Tab 3 — Forecast and scenarios. Monthly totals, a running annual figure, and a block for adjustment multipliers (weather, lifecycle) that flow back into Tab 2.
Keep raw assumptions isolated on Tab 1. When feed prices jump or a cohort shifts stage, you change one cell and the whole forecast updates. Operations that bury assumptions inside formulas scattered across dozens of cells end up afraid to touch the sheet — which means it goes stale by February and nobody trusts it.
Keep raw assumptions isolated on Tab 1. When feed prices jump or a cohort shifts stage, you change one cell and the whole forecast updates. Operations that bury assumptions inside formulas scattered across dozens of cells end up afraid to touch the sheet — which means it goes stale by February and nobody trusts it.
Adjustment rule 1: weather
Cold is the one people underestimate most consistently. Below an animal's lower critical temperature, maintenance energy demand climbs to hold body temperature, and wind and wet drop that threshold further. Roughly, expect maintenance requirements to rise around 1% for each degree below the critical temperature, worse in wet conditions where insulation collapses.
-
Mild winter month
×1.00
-
Sustained cold (below freezing most days)
×1.07–1.10 on maintenance cohorts
-
Severe cold snap, wet or windy
×1.15 applied to the affected days
Two things people consistently get wrong here. First, the multiplier hits maintenance-heavy cohorts hardest — dry cows and gestating cows — not so much the finishing stock already eating near capacity. Apply it selectively. Second, heat stress cuts intake, which sounds like savings but usually shows up as lost gain and lower conception rates. In summer you may reduce the feed budget slightly while flagging a performance risk, not a win.
Adjustment rule 2: lifecycle events
Lifecycle events are scheduled, so there's no excuse for them blindsiding the budget — yet they routinely do, because they get filed under "calving" instead of "a 40% jump in nutritional demand over eight weeks."
-
Calving/lambing/kidding — a cohort shifts from gestating to lactating, jumping from roughly 2.1% to 2.7% DMI within days.
-
Weaning — dams drop back toward maintenance, weaners spin off into their own high-intake growing cohort. Total feed often stays flat while the distribution of spend moves entirely.
-
Breeding/flushing — a short pre-breeding intake bump to hit target body condition.
-
Transitioning onto finishing rations — higher cost per pound even if poundage barely changes.
The fix is to timestamp these on the calendar and let them reassign cohorts in the spreadsheet automatically. If your calving window is March 1 through April 15, then by mid-March a portion of your gestating cohort should already be sitting in the lactating row on Tab 2. Budgets that keep every cow in "gestating" until the whole herd calves are always running a month behind reality.
Where waste actually hides
Waste is the line item people flatten into a lazy 10% and move on from. It varies enormously by feeding system, and it's often the single easiest place to recover real money.
-
Unrolled hay on the ground
25–40% waste
-
Bale rings, no cone
15–20%
-
Cone/sheeted rings
5–10%
-
Bunk-fed processed ration
3–6%
On the December example above, moving the cow cohorts from open bale rings (18% waste) to coned rings (8%) trims roughly 10% off the hay poundage for those cohorts — a few hundred dollars that month, and it compounds across every winter month. Budget waste per feeding system on Tab 1, not as a farm-wide fudge factor, and the sheet starts telling you where to actually invest in feeding infrastructure.
Budget waste per feeding system on Tab 1, not as a farm-wide fudge factor.
On the December example above, moving the cow cohorts from open bale rings (18% waste) to coned rings (8%) trims roughly 10% off the hay poundage for those cohorts — a few hundred dollars that month, and it compounds across every winter month. Budget waste per feeding system on Tab 1, not as a farm-wide fudge factor, and the sheet starts telling you where to actually invest in feeding infrastructure.
When this level of detail makes sense — and when it doesn't
When it's worth it: mixed-stage herds where cohorts genuinely diverge — anyone running cow-calf plus a grow-out or finishing enterprise, or seasonal calving that stacks lactation demand against variable pasture. The more your animals differ in stage at any given moment, the more a blended average misleads you.
When it's overkill: a small, uniform group all on the same ration at the same stage — a straight stocker operation buying and selling in one weight band, for instance. There, a blended figure is close enough and the cohort model is just extra work.
Who should skip it for now: if you don't have reliable body weights or any record of actual intake, fix that first. The step-through method is only as good as the weights feeding into it. Guessing cohort weights to two decimal points just gives you a confidently wrong number.
A short real scenario
A family cow-calf operation running around 170 head had been budgeting winter feed off a single per-head figure and consistently ran over between December and February — usually 15–20% above plan, which on their scale meant a few thousand unbudgeted dollars each winter landing as a cashflow squeeze right when income was thinnest.
Rebuilding the budget by cohort surfaced two things immediately. Their late-gestation cows were being under-fed on paper and over-fed in practice, and their weaners were on a ration priced higher than anyone had actually checked in over a year. Adding a cold-weather multiplier on the maintenance cohorts explained almost the entire December overrun — it wasn't waste, it was unbudgeted thermal demand.
They didn't slash costs dramatically. What changed was that the monthly forecast started landing within a few percent of actual, so the winter cash draw stopped being a surprise. The overrun didn't vanish so much as it moved onto the budget where it belonged.
Keeping it alive through the season
A feed budget is a living document or it's wallpaper. The operations that get real value out of the cohort method revisit Tab 1 monthly — actual weights in, price changes in, cohort reassignments as animals hit lifecycle events. Weights from scale sessions, calving dates, ration cost updates, and weather logs all feed the same forecast rather than living in separate notebooks.
The cohort model isn't more complicated math — it's the same arithmetic done on the right groups instead of a fictional average animal. Build it once, isolate your assumptions on a single tab, layer weather and lifecycle adjustments on top, and the forecast stops fighting you every winter.
Start with your two most divergent cohorts, get those lines accurate, and expand from there. The money is almost always hiding in the two groups you were least willing to average together in the first place.
Start with your two most divergent cohorts, get those lines accurate, and expand from there. The money is almost always hiding in the two groups you were least willing to average together in the first place.
Ready to optimize your farm management?
Join hundreds of farmers using Barnyly to save time, improve animal health, and increase farm productivity.