

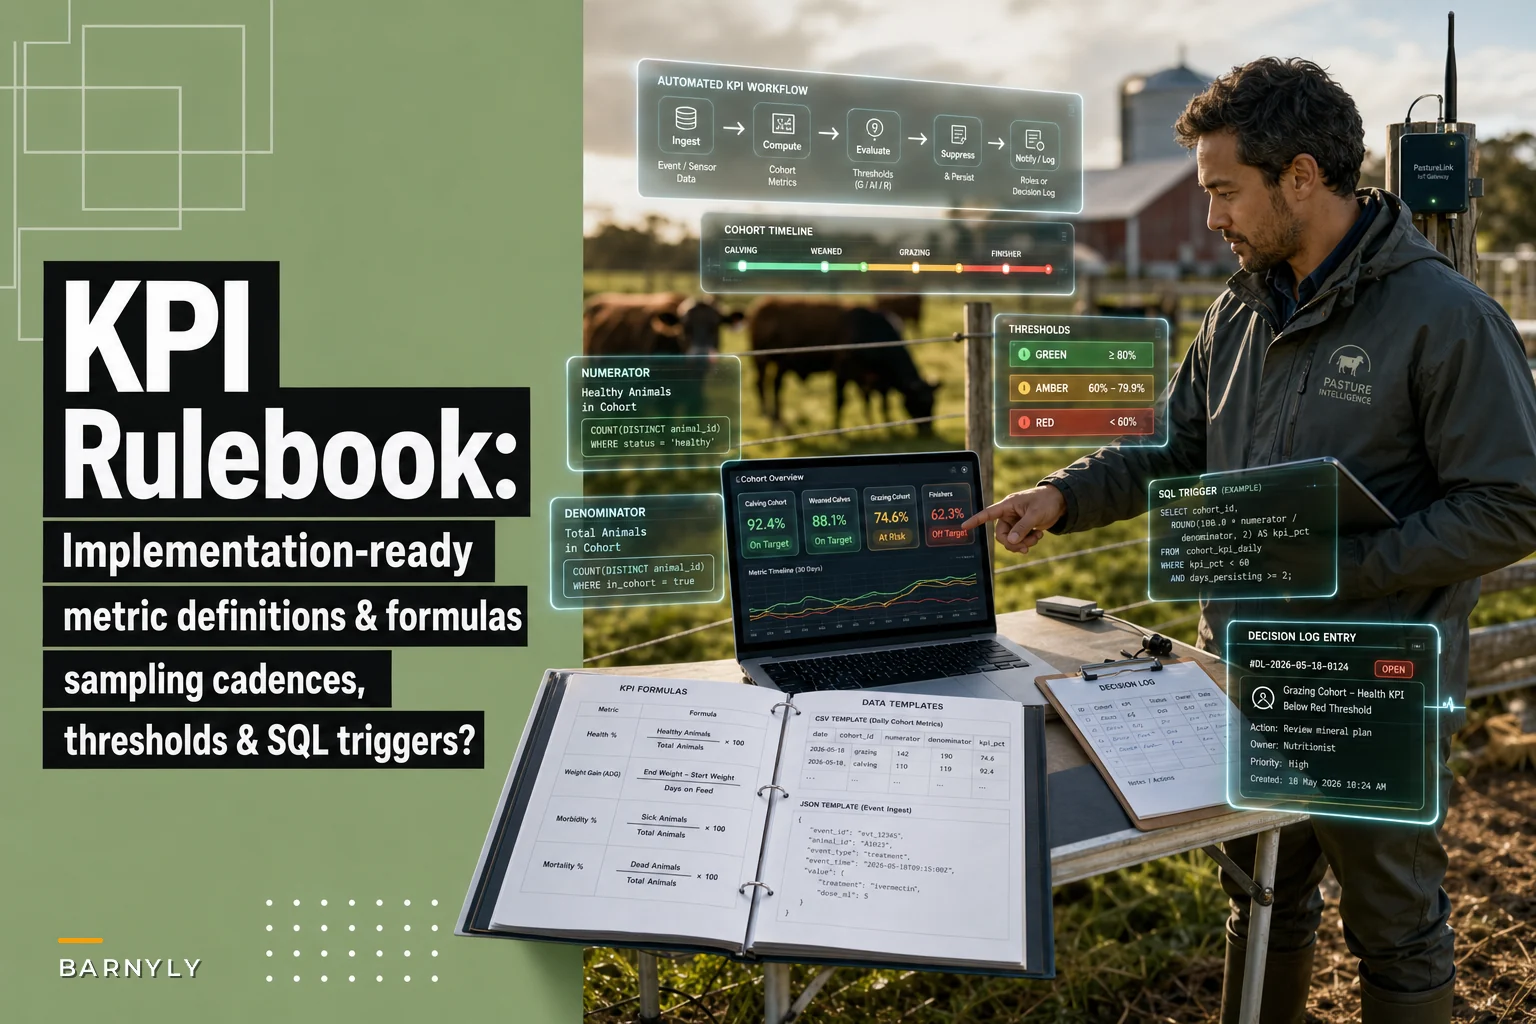

If you've already read through the broader livestock KPI and dashboard playbook with role‑specific metrics and 90‑day decision rhythms, you've probably hit the same wall most operations hit: the recommendations make sense, but nobody wrote down exactly how to compute each number, how often to sample it, or what value should trigger an alert. So the KPIs get built three different ways by three different people, the dashboard disagrees with the spreadsheet, and within a quarter everyone stops trusting the numbers.
This post is the missing spec sheet — the implementation layer where "track weaning weight" becomes a formula with a numerator, a denominator, a unit, a sampling cadence with an actual sample-size justification, and a red/amber threshold set from your own history instead of a gut feeling. The goal is that you could hand this to a developer and a ranch manager and both would build the same thing.
Scope is narrow here. This isn't about which KPIs to pick — that decision was made upstream. This is about writing each one down precisely enough that it survives staff turnover, a new software vendor, and an auditor.
Why KPIs fall apart at the definition layer
The failure almost never happens at the "what should we measure" stage. It happens at the "how exactly do we compute this and when" stage.
A typical example: a cow-calf operation decides to track pre-weaning mortality. Sounds simple. But one person counts stillbirths in the numerator, another excludes them. One divides by calves born alive, another by cows exposed. One pulls the number monthly on the calendar month, another on a rolling 30 days. Three "pre-weaning mortality" numbers now exist, all different, and the manager quietly picks whichever one looks best that week.
The second failure mode is cadence. People sample daily things weekly and seasonal things daily. Body condition score doesn't need daily sampling — the biological signal moves slower than the noise you'd introduce by scoring more often. Water intake on a feedlot pen does need daily granularity because a two-day dip is an early disease signal. Getting cadence wrong either buries you in meaningless data or blinds you to the thing you needed to catch.
The fix for both is boring and effective: write the formula and the cadence down once, with an example calculation, and don't let anyone compute it a second way.
The metric definition template
Every KPI in your rulebook should carry the same fields. Here's the structure I'd use for each entry.
Simplify farm operations and enhance animal care.
Barnyly helps you organize, track, and manage every aspect of your farm operations seamlessly.
- Comprehensive livestock tracking
- Automated health alerts
- Feed and resource scheduling
No credit card required
| Field | What it holds | Example (Pre-weaning mortality) |
|---|---|---|
| Metric name | Canonical name, no synonyms allowed | Pre-weaning mortality rate |
| Formula | Plain arithmetic | (deaths before weaning / calves born alive) × 100 |
| Numerator | Exact event definition | Count of calves that died between live-birth event and weaning event |
| Denominator | Exact population | Count of calves recorded as born alive in the same cohort |
| Unit | What the number means | Percent (%) |
| Cohort basis | How animals are grouped | Birth-month cohort, tracked to weaning |
| Sampling cadence | How often computed | Recomputed weekly; cohort finalized at weaning |
| Data source | Which tables/events | birthevent, deathevent, weaning_event |
| Example calc | A worked number | 4 deaths / 96 born alive = 4.17% |
| Owner | Role accountable | Herd health lead |
A few metric definitions worth getting precise because they're commonly botched:
-
Average daily gain (ADG) (end weight − start weight) / days on feed. Unit: kg/day or lb/day. The trap is inconsistent weigh conditions — gut fill swings an individual weight by several kilos, so define ADG on cohort averages across at least two weigh events, not single-animal single-weighings.
-
Conception rate (animals confirmed pregnant / animals exposed or inseminated) × 100. Decide once whether "exposed" counts natural-service turnout or only AI, and whether recips in an ET program belong in the denominator.
-
Feed conversion ratio (FCR) total feed consumed (as-fed or dry matter — pick one) / total liveweight gain. Mixing as-fed and dry-matter FCR across pens is the single most common benchmarking error I see.
-
Treatment rate (number of animals receiving a treatment in period / average animals at risk in period) × 1000. Expressed per 1000 animal-days so pens of different sizes and different time windows stay comparable.
Fill this out for every single KPI. The "example calc" row matters more than it looks — it's the regression test. If someone rebuilds the metric later and can't reproduce the worked example from the same inputs, their build is wrong.
Choosing sampling cadence with a reason you can defend
"Daily" is not a cadence decision — it's what people reach for because it feels safe. The right cadence depends on how fast the underlying biology moves relative to measurement noise.
The practical rule: sample often enough to catch the shortest change you'd actually act on, and no more often. If you'd never intervene on a one-day blip in body condition, don't score daily.
If you'd never intervene on a one-day blip in body condition, don't score daily.
| Metric | Cadence | Reason |
|---|---|---|
| Water/feed intake per pen | Daily | Early disease signal; 1–2 day dips are actionable |
| Mortality / morbidity | Daily event capture, weekly rate | Events are real-time; rates need a window to be stable |
| ADG / growth | Per weigh event (14–60 days) | Noise from single weighings swamps short intervals |
| Body condition score | Monthly (seasonal: at key transitions) | Slow-moving signal |
| Conception / pregnancy rate | Per breeding cycle | Biologically defined window |
| Lameness prevalence | Weekly locomotion scoring | Progresses over days, not hours |
Sample size when you can't measure every animal
For things like body condition or lameness on a 600-head group, you score a sample, not the whole mob. The question is how many.
For a prevalence estimate, use the standard proportion sample-size formula:
n = (Z² × p × (1 − p)) / e²
Where Z is 1.96 for 95% confidence, p is your expected prevalence (use 0.5 if you have no prior — it's the most conservative), and e is the margin of error you'll tolerate.
Worked example: You expect lameness around 8% (p = 0.08), want 95% confidence and a ±5% margin (e = 0.05):
n = (1.96² × 0.08 × 0.92) / 0.05² n = (3.8416 × 0.0736) / 0.0025 n = 0.2827 / 0.0025 ≈ 113
Score about 113 animals. For a finite herd of 600, apply the finite population correction:
nadj = n / (1 + (n − 1)/N) nadj = 113 / (1 + 112/600) ≈ 95
Roughly 95. That's a number you can defend to a vet or an auditor, instead of "we looked at some of them."
Build a small lookup template so staff never do this math in the field — a CSV with columns expectedprevalence, margin, herdsize, required_sample precomputed for your common group sizes works fine.
Setting amber and red thresholds from your own history
The worst thresholds are borrowed from a textbook or a neighbor's operation. Your weaning weights, your genetics, your season — the "normal" range is yours, and the thresholds should come from your own baseline.
Step-by-step threshold setting
-
Pull at least 12 months of the metric, ideally 2–3 seasons, so you capture the normal seasonal swing.
-
Compute the mean and standard deviation over a stable period — exclude known disasters like a disease outbreak, since those aren't "normal variation."
-
Set control limits using the mean ± standard deviations
- Amber = mean ± 2 standard deviations (expect roughly 5% of normal points to cross this) - Red = mean ± 3 standard deviations (expect around 0.3% — a genuine outlier)
-
Pick the direction that matters. For mortality you only care about the upper limit. For conception rate, the lower. Don't alert on "good" deviations.
-
Sanity-check against biology and cost. If 3-sigma lands at a mortality rate you'd consider a crisis well before it got there, override with a hard business threshold. Statistics set the default; your judgment sets the floor.
Worked example — weekly pre-weaning mortality rate:
Say 18 months of weekly data gives a mean of 2.1% and a standard deviation of 0.8%.
Amber (upper) = 2.1 + (2 × 0.8) = 3.7% Red (upper) = 2.1 + (3 × 0.8) = 4.5%
Below 3.7% is green, 3.7–4.5% is amber (watch, investigate), above 4.5% is red (escalate now). These come from your herd, so when the amber trips, it means "this is genuinely unusual for us," not "this crossed a line someone picked in a journal."
One thing worth flagging: thresholds drift. If your genetics or management improved, last year's mean is stale. Rebaseline the control limits every 6–12 months, or you'll be alerting against a herd that no longer exists.
A minimal data model to support all of this
You don't need a sprawling schema. You need enough entities to compute every formula above and nothing you won't maintain.
Minimal entity list:
-
animal — id, species, birthdate, sex, damid, sireid, currentgroup_id, status
-
group — id, type (pen/paddock/mob), site_id
-
event — id, animalid (nullable for group events), groupid, eventtype, eventdate, value, unit, recorded_by
-
weigh — animalid, weighdate, weight, weigh_condition
-
treatment — animalid, product, dose, treatmentdate, withdrawalenddate, operator
-
metricresult — metricname, cohortid, periodstart, periodend, value, computedat
-
threshold — metricname, ambervalue, redvalue, direction, effectivefrom
The event table does most of the heavy lifting — births, deaths, weanings, heats, and pregnancy checks are all events with a type and a value. Keeping them in one typed table instead of a dozen bespoke tables is what makes the SQL below stay short. If you want a fuller treatment of the underlying record model, that's its own topic, but this slice is enough to run the rulebook.
SQL and pseudo-code for automated triggers
Here's the pattern for computing a metric result and firing an escalation. Deliberately plain so your engineers can drop it into whatever stack you run.
Compute weekly pre-weaning mortality for each birth cohort:
INSERT INTO metricresult (metricname, cohortid, periodstart, periodend, value, computedat) SELECT 'preweaningmortality', a.birthcohortid, datetrunc('week', now()) - interval '7 days', datetrunc('week', now()), 100.0 * COUNT(d.animalid) FILTER (WHERE d.eventtype = 'death') / NULLIF(COUNT(b.animalid) FILTER (WHERE b.eventtype = 'birthalive'), 0), now() FROM animal a LEFT JOIN event b ON b.animalid = a.id AND b.eventtype = 'birthalive' LEFT JOIN event d ON d.animalid = a.id AND d.eventtype = 'death' GROUP BY a.birthcohortid;
Evaluate against thresholds and raise an alert:
SELECT m.metricname, m.cohortid, m.value, CASE WHEN m.value >= t.redvalue THEN 'RED' WHEN m.value >= t.ambervalue THEN 'AMBER' ELSE 'GREEN' END AS status FROM metricresult m JOIN threshold t ON t.metricname = m.metricname AND t.direction = 'upper' WHERE m.computedat = ( SELECT MAX(computedat) FROM metricresult WHERE metricname = m.metricname AND cohortid = m.cohortid );
Escalation pseudo-code:
for each result where status in (AMBER, RED): if suppressed(result): continue if status == RED: notify(role='herdhealthlead', channel='sms', result) opendecisionlogentry(result) else: # AMBER notify(role='herdhealthlead', channel='email', result) recordalert(result, sent_at=now())
A simple workflow diagram for the automated trigger looks like this.
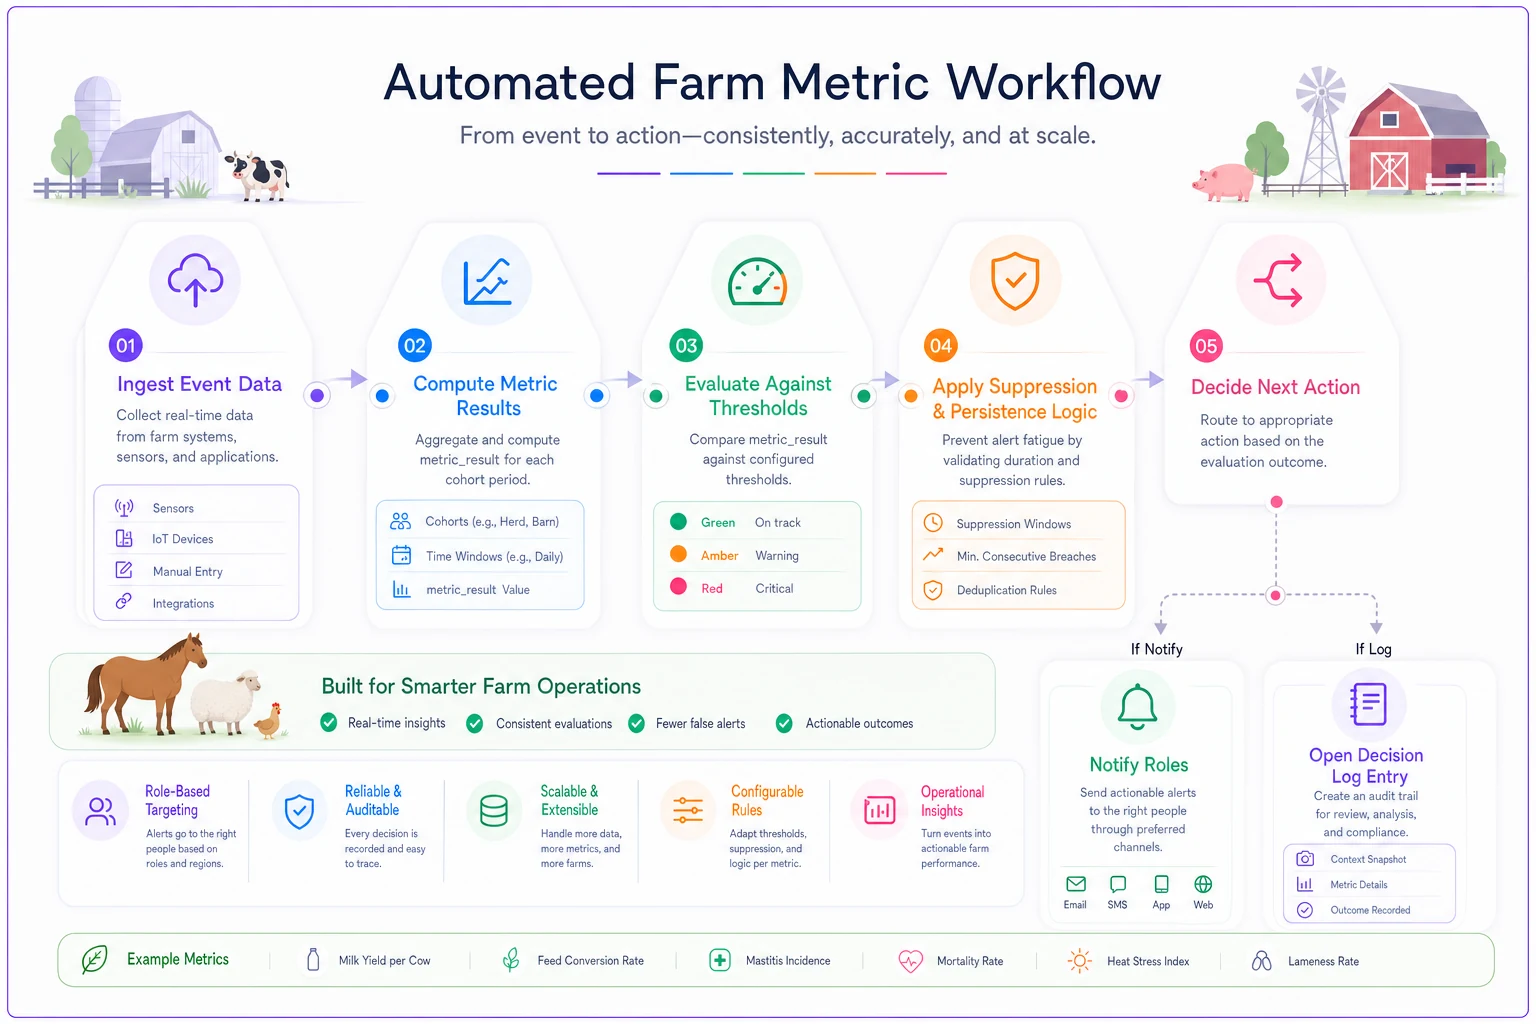
Deliberately plain so your engineers can drop it into whatever stack you run.
Alert messages and suppression rules
Alerts that are noisy get muted, and muted alerts are the same as no alerts. Two things keep them trustworthy: a message specific enough to act on, and suppression rules that stop the same thing firing every hour.
Sample alert text:
> RED — Pre-weaning mortality, Spring cohort A > Current: 4.8% (red threshold 4.5%, baseline 2.1%) > 5 deaths / 104 born alive, last 7 days. > Action: herd health lead to review cohort today and open decision log.
It carries the value, the threshold, the baseline, the raw counts, and the next action. A good alert doesn't make the reader go look something up.
Suppression rules worth implementing:
-
Debounce don't re-fire the same metric/cohort alert more than once per 24 hours unless status worsens — amber → red should always break through.
-
Require persistence for amber amber trips only if two consecutive samples are amber, filtering single-point noise. Red fires immediately.
-
Acknowledge-to-silence once a human acknowledges and logs a decision, suppress repeats for a defined window (say 72 hours) while they work it.
-
Maintenance windows suppress intake-based alerts during known events like a planned mob move or weigh day, when readings are naturally disrupted.
The pattern worth avoiding: raising the threshold because an alert is annoying. That's how you turn off the smoke detector because it keeps going off. Fix the debounce and persistence logic instead.
The 90-day decision log and meeting agenda
Numbers don't change anything on their own. The decision log is where a tripped threshold becomes a recorded choice you can look back on.
Fillable decision-log entry (one row per decision):
-
Date
-
Metric and cohort that triggered it
-
Value vs amber/red threshold
-
Observation / likely cause
-
Decision made
-
Owner
-
Review date
-
Outcome (filled in at review)
Recurring agenda for the review meeting (every two weeks works for most):
-
Any RED events since last meeting — what was done, what was the outcome?
-
Persistent AMBERs that didn't resolve.
-
Metrics trending toward amber but not there yet (early look).
-
Thresholds due for rebaselining.
-
Open decision-log items past their review date.
-
Data quality flags (see checklist below).
The outcome column is the part people skip and also the most valuable part. Without recorded outcomes, the decision log can't tell you whether your thresholds are set right. After a quarter you look back: did the reds correspond to real problems? Did ambers you ignored turn into reds? That's how you tune the whole system.
Data-quality checklist
Every metric in this spec is only as good as the events feeding it. Run this checklist before trusting a dashboard:
-
[ ] Every death event has a matching animal with a birth event (no orphan deaths)
-
[ ] No animals with a weaning event dated before birth
-
[ ] Weigh events carry a weigh_condition (fasted/unfasted) so ADG is comparable
-
[ ] Denominators are never zero or null in computed metrics (NULLIF guards in place)
-
[ ] Each metric_result has a threshold row with a matching effective date
-
[ ] Treatment events have withdrawalenddate populated
-
[ ] No duplicate events for the same animal/type/date
-
[ ] Cohort assignment is complete — no animals with null cohort feeding a cohort metric
-
[ ] Timestamps are in one timezone across all sites
-
[ ] recorded_by is populated so you can trace who entered what
A metric that silently drops animals with missing cohort IDs will quietly understate your mortality for months. The checklist catches the silent failures, which are the dangerous ones.
A short real scenario
A mixed cow-calf and backgrounding operation running around 700 head had three versions of "treatment rate" floating around — one from the vet's spreadsheet, one from the feedlot software, one the manager tallied by hand. They never matched, so nobody actually used any of them to change anything.
They sat down and wrote one definition: treatments per 1000 animal-days, numerator from the treatment table, denominator from average animals-at-risk per pen per period. They baselined 14 months, set amber at 2 standard deviations, red at 3, added the persistence rule so single busy days didn't fire, and wired the SQL to post a weekly result.
Nothing dramatic happened in week one. But over the next couple of months, a backgrounding pen crept into amber twice, both times tied to a specific water trough issue they'd been writing off as "just a rough patch." Because it was now a logged amber with an owner and a review date, it got fixed instead of forgotten. Treatment rate in that pen settled back toward baseline — and more to the point, everyone was finally arguing about the same number.
That's the real payoff. Not a fancier dashboard. One definition, one cadence, one set of thresholds from your own history, and a log that turns alerts into decisions you can review later.
When this level of rigor makes sense — and when it doesn't
This spec is worth the effort when you're running multiple sites or multiple people are entering data, because that's exactly when definitions drift. It's also worth it heading into an audit, a benchmarking program, or a software migration, where "we compute it three ways" becomes a real liability.
It's overkill if you're a single operator with a handful of animals and a notebook. You don't need control limits on a 30-head flock — you'll see the problem walking the paddock before any threshold trips. Build the spec when the herd and the team are big enough that you can't just eyeball it anymore.
The one group that should not do this halfway: anyone who'll set up the alerts but skip the decision log. Alerts without recorded decisions just train your team to ignore notifications. If you're not going to log the outcomes and review them, keep the metrics simpler and spend the energy somewhere you'll actually use it.
Ready to optimize your farm management?
Join hundreds of farmers using Barnyly to save time, improve animal health, and increase farm productivity.