

Most operations aren't short on data anymore. There's a weigh scale spitting out numbers, a vet invoice with treatment counts, a feed delivery ticket, a breeding log somebody keeps in a notebook. The problem isn't collection — it's that none of it turns into a decision anybody actually makes on a Tuesday morning.
A KPI is only worth building if it changes what someone does. If nobody looks at conception rate until the vet mentions it at pregnancy check, that's not a KPI — it's a post-mortem. The whole point of a livestock KPI dashboard is to close the gap between something happening in the pasture and someone acting on it before it costs money.
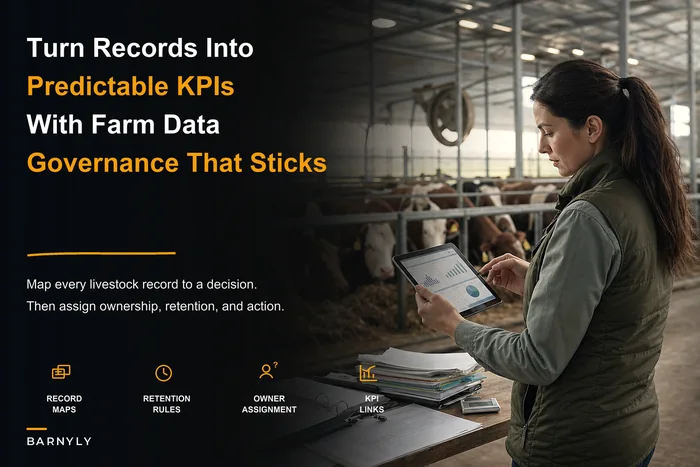
This playbook isn't a list of every metric you could possibly track. It's about picking 8–12 numbers that matter per role, putting them where the right person sees them daily, and building a rhythm so those numbers stop being trivia and start triggering real decisions. If you've already read our take on why a practical farm data strategy turns livestock records into predictable KPIs, this is the operational layer that sits on top of it.
Why most farm dashboards fail before they start
The usual failure isn't technical. It's that one dashboard gets built to show everything, and it ends up serving nobody.
Think about who's actually looking. The owner cares about margin per head and cash timing. The herd manager cares about which animals need attention this week. The nutritionist cares about intake, body condition, and whether the ration is landing right. Three completely different jobs. Cram them all onto one screen and every person scrolls past 80% of it to find their one relevant number — and then stops opening it entirely within a month.
The second failure is lag. A conception rate that shows up 45 days late is a history lesson. A death loss number that updates once a quarter can't warn you about the scours outbreak building right now. Metrics have a freshness window, and if the reporting cycle is slower than the decision cycle, the metric is dead weight.
The third failure is subtler: nobody defines the trigger. A number sitting at "12%" means nothing unless someone decided in advance that 12% is where you pick up the phone. Without a threshold, dashboards become wallpaper.
Assign metrics to whoever can act on them
The core principle: a KPI belongs to whoever can change it. If the number moves and that person can't do anything about it, it's on the wrong screen.
Simplify farm operations and enhance animal care.
Barnyly helps you organize, track, and manage every aspect of your farm operations seamlessly.
- Comprehensive livestock tracking
- Automated health alerts
- Feed and resource scheduling
No credit card required
Owner / operator (the money and direction view)
The owner shouldn't be staring at individual animal weights. They should be watching the health of the whole operation and where it's drifting. Four or five numbers is plenty:
-
Net margin per head (rolling 90-day) — the single most honest number on the farm
-
Feed cost per pound of gain — ties directly to your biggest variable expense
-
Weaning-to-sale conversion — how many animals that entered actually finished profitably
-
Death loss %, all classes — a lagging safety indicator that flags systemic problems
-
Cash timing vs. planned — when money is actually landing against when bills are due
The owner's view is about pattern and direction, not daily action. If margin per head is sliding three periods in a row, that's a strategy conversation, not a "go fix a pen" task.
Herd manager (the this-week operational view)
This is the busiest dashboard and the one that needs to be freshest. The herd manager works in days, sometimes hours.
-
Animals flagged for attention today (treatment due, off-feed, lame, isolated)
-
Average daily gain by group vs. target for that life stage
-
Treatment rate per 100 head (rolling 14-day) — early warning for disease pressure
-
Breeding events on schedule vs. behind (heat detection, AI timing, preg checks due)
-
Pen/paddock moves pending against the rotation plan
The insight most people miss: the herd manager's KPIs should be forward-looking tasks, not backward-looking averages. "Three cows overdue for preg check" beats "conception rate: 88%" because one tells you what to do today and the other just describes the past.
Nutritionist / feed lead (the intake and condition view)
Whether this is an outside consultant or someone on staff, their numbers connect biology to cost.
-
Dry matter intake per head vs. formulated — the gap between what you fed and what they ate
-
Body condition score distribution by group — trending, not one snapshot
-
Feed conversion ratio by life stage
-
Ration cost per head per day — because a "better" ration that blows the budget isn't better
-
Refusal / waste % — the number nobody tracks that quietly bleeds margin
Nutritionists often get judged on gain, but gain is a shared outcome. If body condition is fine but gain lags, the problem might be health or heat stress, not the ration. Keeping their KPIs focused on intake and condition — the things they actually control — keeps the accountability honest.
A quick comparison of the three role dashboards
Splitting it this way isn't about tidiness.
| Dimension | Owner view | Herd manager view | Nutritionist view |
|---|---|---|---|
| Time horizon | 90-day trend | Daily / weekly | Weekly / by feeding period |
| Refresh need | Weekly is fine | Daily, ideally real-time | Every feed cycle |
| Metric type | Financial outcomes | Actionable tasks | Intake & condition inputs |
| Primary question | "Are we profitable and stable?" | "What needs doing this week?" | "Is the ration landing right?" |
| Wrong metric to include | Individual animal weights | Quarterly margin | Sale price per head |
Each person opens their screen and everything on it is relevant — that's the difference between a dashboard people actually check and one they abandon after two weeks.
What the wireframes should actually look like
You don't need fancy design. You need hierarchy.
Top row — the "should I worry?" strip. Three to four big numbers with color states. Green, amber, red. This is the glance you take with coffee. For the herd manager it might be: animals flagged today, treatment rate trend, breeding events behind. If everything's green, you move on.
Middle band — the trend context. Small line charts showing the last 90 days for each headline number. A single red box up top doesn't tell you if it's a blip or a slide. The trend does.
Bottom section — the drill-down list. The actual animals or groups behind the numbers. Click "3 flagged," get the three ear tags, their pen, and the reason. This is where a dashboard becomes a work list instead of a report.
The common mistake is inverting this — leading with detailed tables and burying the summary. People read top-left first. Put the decision there.
Daily alerts: the layer that makes it live
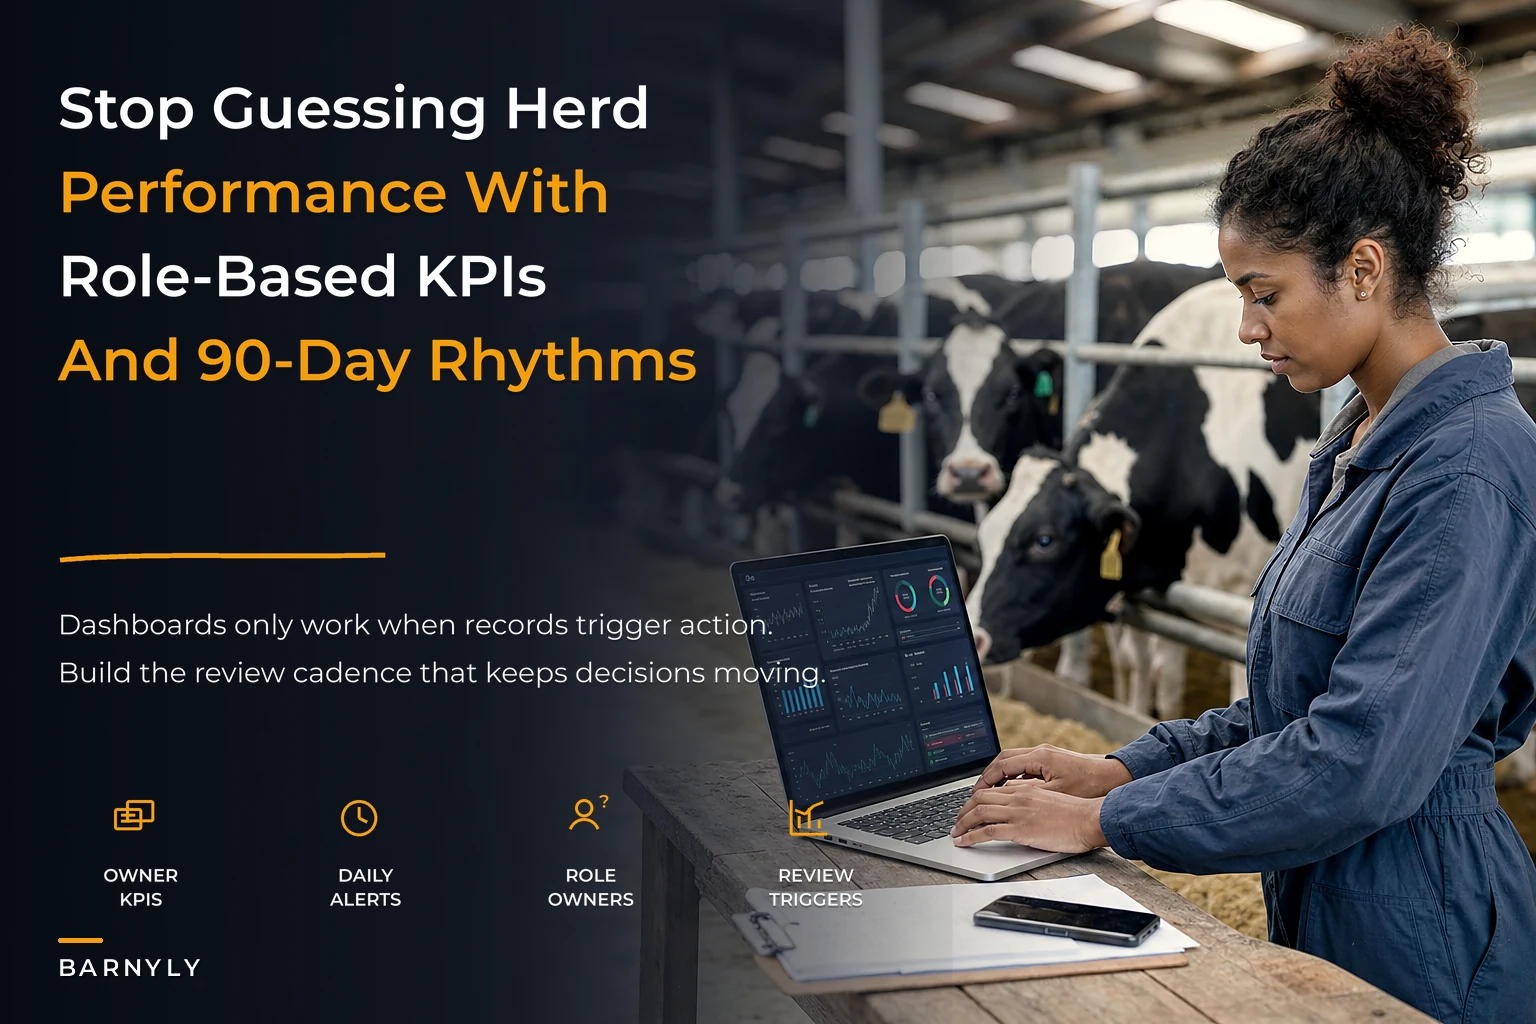
A dashboard someone has to remember to open is already losing. The alert layer pulls important stuff to the person instead of waiting for them to go looking.
One rule for alerts: only alert on things that need a decision today. Everything else stays on the dashboard.
-
Treatment rate crossed your 14-day threshold (say, more than 5 per 100 head)
-
An animal off-feed for two consecutive readings
-
A breeding event window opening or closing in the next 48 hours
-
Feed inventory dropping below the reorder point for a given group
-
Death loss recorded — the owner sees this same-day, no exceptions
Bad alerts — the kind that train people to ignore everything — are the "FYI, gain was slightly below target this week" type. That belongs on the trend chart, not in someone's phone at 6am.
Tune alert thresholds during a quiet period to avoid alarm fatigue.
This is where AI-assisted operational platforms earn their keep, honestly. Not through anything flashy — just by watching incoming records continuously and applying your thresholds automatically. A rising treatment rate or a slipping intake number surfaces the moment it crosses the line instead of at the next scheduled review. The judgment stays with your team. The watching happens in the background. When records flow in from scales, feed systems, and treatment logs, the platform flags exceptions and routes them to the right role — the herd manager gets the animal flags, the owner gets death loss and margin drift, and nobody drowns in the other person's noise.
The 90-day review rhythm (where records become repeated decisions)
Daily alerts handle the urgent. The 90-day rhythm handles drift — the slow problems that never trip an alarm but quietly erode margin.
A review cadence that actually holds up:
-
Weekly (15 minutes, herd manager solo) Clear the flag list, confirm breeding events happened on schedule, note anything trending toward a threshold. Maintenance, not analysis.
-
Monthly (30–45 minutes, herd manager + nutritionist) Review gain by group against target, intake vs. formulated, body condition trend. Decide on ration or grouping adjustments. Write down what you changed and why — that note is what makes next month's review make sense.
-
90-day (60–90 minutes, all three roles) This is the real decision meeting. Owner brings margin per head and feed cost per gain. Herd manager brings conception rate, death loss, treatment patterns. Nutritionist brings conversion and cost per head per day. You're looking for the story across the numbers, not each number in isolation.
The thing that makes the 90-day rhythm actually work — and this is where most farms drop it — is the written decision log. Every review ends with: what did we decide, who owns it, what number do we expect it to move, and by when. Ninety days later you check whether it moved. That loop is the entire point. Without the log, every review starts from scratch and you re-argue the same points forever.
Here's a simple visual of the 90-day decision loop.
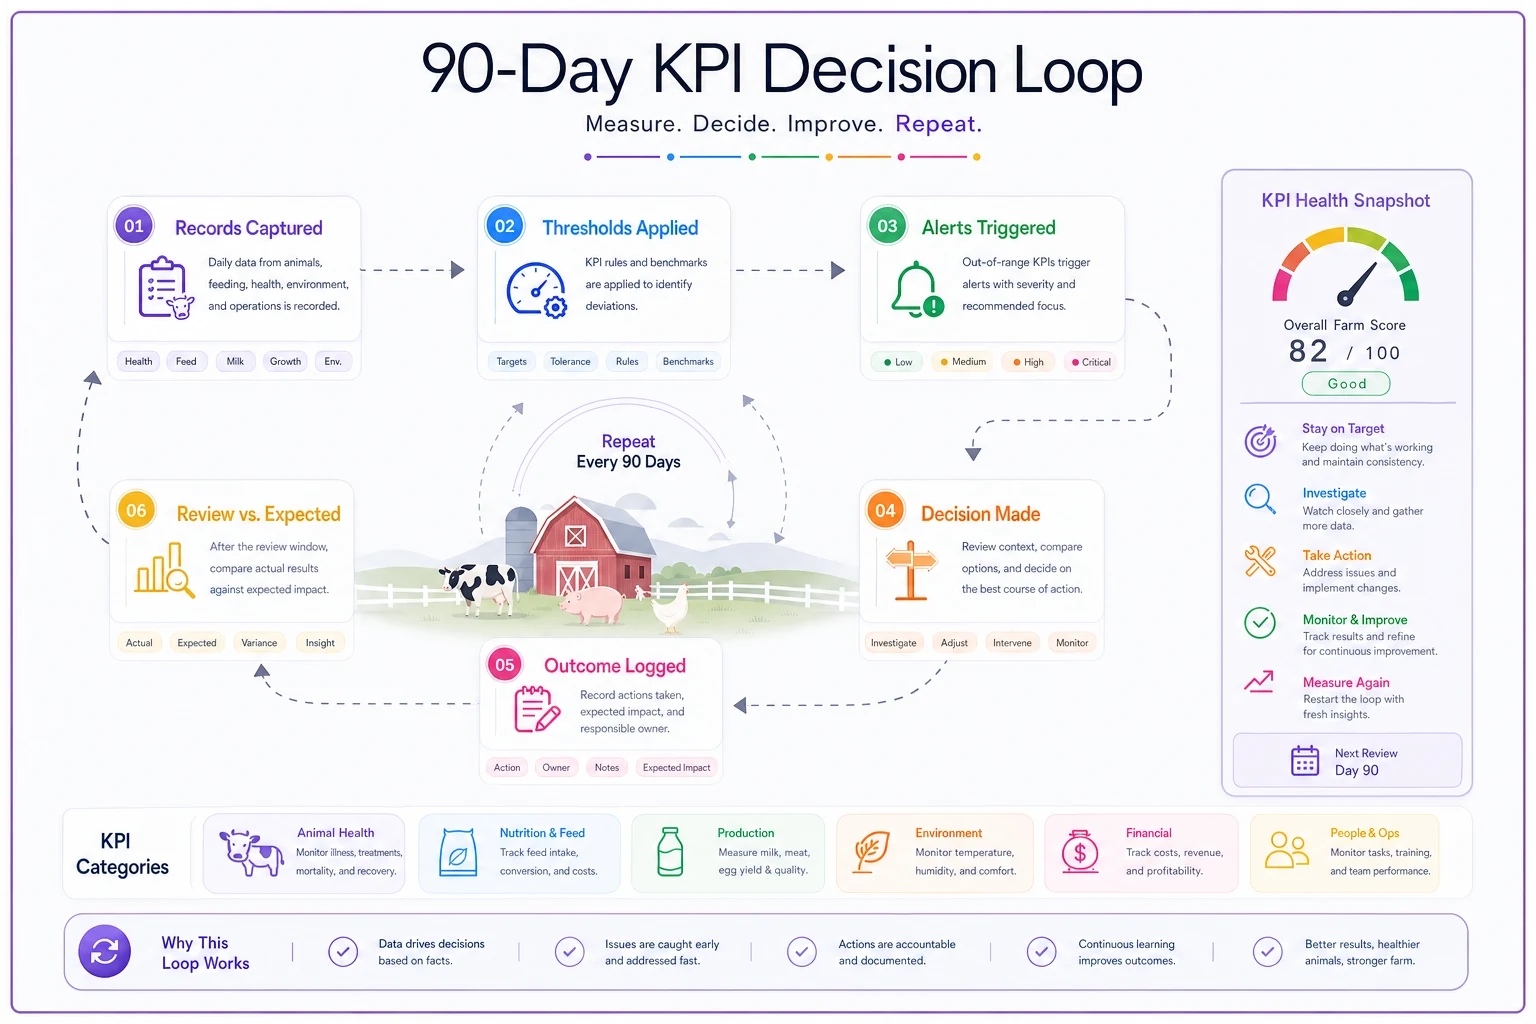
The written log is also what separates operations that improve year-over-year from ones that stay flat. If you can't point to a decision you made last quarter and say whether it worked, you're not managing with data — you're just collecting it.
Escalation rules: deciding in advance so you're not deciding in a crisis
Thresholds without escalation are just numbers. The escalation rule says what happens when a number goes red and who owns the response.
-
Amber (watch) Metric drifting toward the limit. Herd manager notes it, watches daily, no other action yet.
-
Red (act) Threshold crossed. Herd manager investigates within 24 hours, logs the cause, takes first-line action (isolate, adjust, call vet).
-
Critical (escalate) Red plus one of — spreading across groups, death loss involved, or unresolved after 48 hours. Owner is notified same-day and the response becomes a shared decision.
The pattern to avoid: leaving "when do we call the vet" or "when do we cull" as a judgment call made fresh every time, under stress, by whoever's standing there. Deciding the trigger in advance, when everyone's calm, removes the hesitation that costs animals and money. A treatment rate hitting your critical threshold should launch the same response every time, regardless of who's on shift.
A real scenario: the mid-size cow-calf operation
A cow-calf operation running around 320 head had records everywhere — a spreadsheet for breeding, paper treatment cards, feed tickets in a drawer, weights in the scale software. The owner roughly knew performance but couldn't say what margin per head was without a weekend of adding things up.
Their real problem showed up at weaning. Death loss in the 0–90 day window ran higher than it should — somewhere in the 6–7% range some years — but nobody caught the clusters early because scours cases were noted on cards nobody consolidated until the vet visited.
They didn't buy anything complicated. They defined nine KPIs across the three roles, set thresholds, and set up a treatment-rate alert that pulled from each day's treatment entries. First season, the herd manager caught a scours cluster building in one calving group about a week earlier than usual — treatment rate crossed the line, alert fired, cause got logged, whole group management shifted. Death loss in that window came down to roughly 4%. On 320 head that's a handful of calves that lived, plus smaller vet bills because problems were caught before they spread.
The owner's honest comment afterward wasn't about the technology. It was that for the first time the 90-day meeting had actual numbers to argue over instead of gut feelings.
When this playbook makes sense — and when it doesn't
When it's worth it: You're past the point where one person holds everything in their head. Roughly when you've got multiple people touching the animals, or an outside nutritionist and vet, and coordination is starting to slip. If you've built out repeatable SOPs and handover templates, KPIs are the natural next layer — the SOPs standardize the how, the KPIs tell you whether the how is working.
When it's premature: If you're running a small flock and personally see every animal daily, a formal dashboard is overhead you don't need yet. Track three numbers, not twelve. You'll feel when it's time — usually when you catch yourself surprised by something at sale or preg check that you should've seen coming.
Who should hold off: Anyone whose underlying records aren't reliable. A dashboard on top of inconsistent data just gives you confident wrong numbers, which is worse than knowing you're guessing. Fix the record capture first. Clean inputs, then metrics, then automation. Not the other way around.
Bringing it together
The gap on most farms isn't between having data and not having it. It's between having data and having decisions. A livestock KPI dashboard only pays off when each metric belongs to a person who can act on it, sits at the freshness the decision needs, and carries a threshold that fires before the problem gets expensive.
Split the views by role. Keep the herd manager forward-looking, the owner on trends and money, the nutritionist on intake and condition. Alert only on what needs a decision today. Run the weekly-monthly-90-day rhythm with a written decision log so you're building on last quarter instead of re-litigating it. Decide your escalation triggers when you're calm, not when an animal's down.
Do that consistently, and records stop being a filing problem and start being what they should have been all along — the thing that tells you what to do next.
The gap on most farms isn't between having data and not having it. It's between having data and having decisions. A livestock KPI dashboard only pays off when each metric belongs to a person who can act on it, sits at the freshness the decision needs, and carries a threshold that fires before the problem gets expensive.
Split the views by role. Keep the herd manager forward-looking, the owner on trends and money, the nutritionist on intake and condition. Alert only on what needs a decision today. Run the weekly-monthly-90-day rhythm with a written decision log so you're building on last quarter instead of re-litigating it. Decide your escalation triggers when you're calm, not when an animal's down.
Do that consistently, and records stop being a filing problem and start being what they should have been all along — the thing that tells you what to do next.
Ready to optimize your farm management?
Join hundreds of farmers using Barnyly to save time, improve animal health, and increase farm productivity.