


Most farms don't fail welfare audits because their animals are treated badly. They fail because nobody can prove the animals were treated well. There's a huge gap between "we do the right things" and "here are the dated records showing we did the right things, sampled at the right frequency, escalated when thresholds were breached." Assurance schemes live entirely in that second world.
That's the whole problem with welfare KPIs on most farms — they're either non-existent, or so sprawling that nobody maintains them past the first busy month. You end up with 40 spreadsheets, half abandoned, and when the auditor walks the pens, you're reconstructing a paper trail from memory and gut feel.
This article lays out a compact welfare KPI set — 8 to 12 metrics you can actually keep alive — with sampling cadences, who owns what, a dashboard you can sketch on one page, and an evidence-pack structure mapped to what schemes actually ask for at 30, 90, and 365 days. The goal isn't more measurement. It's defensible measurement.
Why welfare KPIs collapse under their own weight
The typical failure isn't neglect. It's ambition. A farm gets serious about welfare after a near-miss or a new buyer requirement, and someone builds a monster tracking system: lameness scores by leg, body condition on a nine-point scale for every animal, water flow rates per trough per hour, hock lesions photographed weekly. Comprehensive on paper. Dead within six weeks because nobody has time to score 400 animals individually while also feeding, treating, and moving them.
Welfare data has a "maintenance budget" — a realistic number of minutes per week people will actually spend recording it. If your KPI framework exceeds that budget, it doesn't degrade gracefully. It stops entirely, and you're left with a partial record that's arguably worse than none, because it shows the auditor you had a system and abandoned it.
The second failure is measuring things that don't drive decisions. If you're logging a number but nobody ever changes a management action based on it, that number is theater. Auditors can smell theater. They'll ask "what did you do when this metric moved?" and if the answer is nothing, the whole record loses credibility.
So the design constraint is brutal but freeing: pick the fewest metrics that (a) map to a scheme requirement, (b) are cheap to sample, and (c) trigger a real action when they cross a line.
The compact KPI set (aim for 8–12, not 40)
Below is a working set that covers the welfare domains most assurance schemes care about — nutrition, health, housing/environment, behavior, and mortality — without drowning your team. Adjust thresholds to your species and your scheme's specific standard.
Simplify farm operations and enhance animal care.
Barnyly helps you organize, track, and manage every aspect of your farm operations seamlessly.
- Comprehensive livestock tracking
- Automated health alerts
- Feed and resource scheduling
No credit card required
| KPI | What it captures | Sampling cadence | Sampling method | Action trigger |
|---|---|---|---|---|
| Mortality rate (rolling 30-day, by group) | Baseline welfare + disease signal | Daily events, reviewed weekly | Death log, cause noted | Above group baseline → vet review |
| Body condition score distribution | Nutrition adequacy over time | Monthly, sampled subset | Score ~15–20% of group | >15% out of target band → feed review |
| Lameness / mobility score | Foot health, housing surface | Fortnightly, walk-through | Locomotion score sample | Rising trend or any severe cases → intervention |
| Water availability check | Access + function | Daily quick check | Visual + flow spot-check | Any failed point → same-day fix, logged |
| Space compliance / stocking density | Housing pressure | On restock + monthly | Headcount vs pen area | Over limit → destock plan |
| Treatment rate (animals treated / group) | Health burden | Continuous, reviewed monthly | From medicine records | Spike vs baseline → cause investigation |
| Culls for welfare reasons | Chronic/unresolved cases | Per event, monthly rollup | Cull log with reason | Rising share → root-cause review |
| Ventilation / temperature excursions | Environmental control | Daily (housed) or per weather event | Log + sensor if available | Excursion → corrective action noted |
| Handling / injury incidents | Stockmanship + facilities | Per event | Incident log | Any → review handling SOP |
| Downer / emergency response time | Response capability | Per event | Timestamped log | Slow response → training flag |
That's ten. You can trim to eight for a simpler operation — drop ventilation and handling logs into a general "environment/incident" log — or add colostrum-quality and weaning-weight metrics if young stock is a big part of your welfare story.
The important thing isn't the exact list. It's the shape. Each row has a cadence and a trigger. A KPI without a cadence gets sampled randomly, which auditors distrust. A KPI without a trigger is just a number in a file.
If you want the deeper mechanics of how to structure metrics so they actually drive weekly and 90-day decisions rather than just accumulate, the livestock KPI and dashboard playbook goes further into decision rhythms and role-specific metric ownership.
Sampling cadence: the part everyone gets wrong
The mistake is treating cadence as "how often we feel like recording." Real cadence has to be tied to how fast the underlying thing can change and to what's actually provable.
A few patterns worth internalizing:
-
Continuous-event metrics (mortality, treatments, incidents) are logged the moment they happen and reviewed on a fixed schedule. The logging is opportunistic; the review is disciplined. Auditors check both — that events were captured in real time, and that someone looked at the aggregate.
-
Sampled metrics (body condition, lameness) don't need every animal. A consistent 15–20% sample, taken the same way each time, is more credible than a heroic full-herd score done once and never repeated. Consistency beats completeness.
-
Trigger-driven metrics (ventilation excursions, water failures) are logged by exception. No excursion, a quick "checked, OK" note. Excursion, a full corrective-action entry.
One subtle thing: the same person should ideally take the sampled scores each time, or at least people should be calibrated against each other. Body condition scoring drifts badly between assessors. If your lameness rate suddenly "improves" the month a new hand takes over scoring, that's not welfare getting better — that's your measurement getting looser. Auditors and buyers both catch this.
Have the same assessor do sampled scoring or schedule regular calibration sessions to prevent scoring drift.
Body condition scoring drifts badly between assessors. If your lameness rate suddenly "improves" the month a new hand takes over scoring, that's not welfare getting better — that's your measurement getting looser. Auditors and buyers both catch this.
The one-page dashboard wireframe
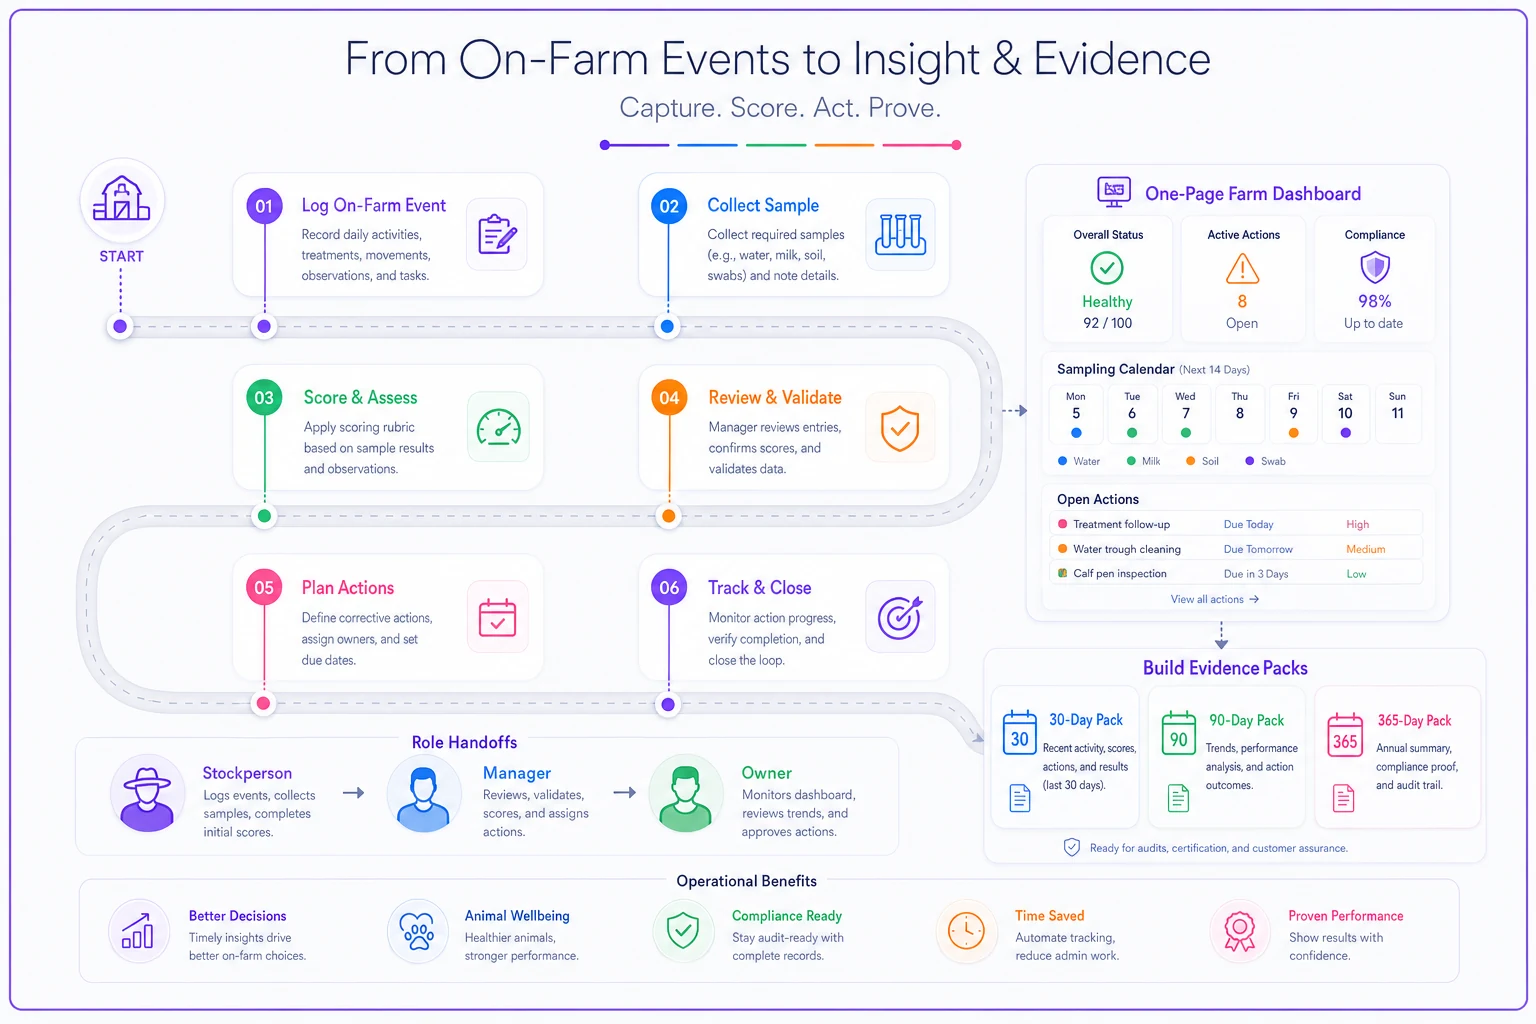
Forget fancy visuals. A welfare dashboard that survives contact with a real farm fits on one screen or one printed page, and it answers three questions at a glance: What's trending wrong? What's overdue for sampling? What action is open?
Top strip — status band (traffic-light row): Ten small cells, one per KPI. Green = within threshold and sampled on time. Amber = trend moving wrong OR sampling overdue. Red = threshold breached with no logged action.
Left column — trend sparklines: For the metrics that change over time (mortality, BCS distribution, lameness, treatment rate), a tiny 12-period trend line. You're looking for direction, not precision.
Center — sampling calendar: A simple grid showing which metric is due when, and what's overdue. Most farms skip this part, and it's exactly what an auditor uses to catch you. "You say you score condition monthly — show me the last six." An overdue-sampling view is your early warning.
Right column — open actions: Every red or amber item generates an action with an owner and a due date. Nothing is "resolved" without a dated note. This column is your corrective-action log, which is a scheme requirement in almost every framework.
Bottom — 30/90/365 evidence status: Three small indicators showing whether your evidence pack for each window is complete. More on that below.
The dashboard's real job is making gaps visible before the auditor sees them. If your sampling calendar is showing three overdue items and two open actions with no notes, you already know how the visit will go.
Here's a quick visual idea of how the pieces flow together.
The dashboard's real job is making gaps visible before the auditor sees them. If your sampling calendar is showing three overdue items and two open actions with no notes, you already know how the visit will go.
Who owns what: role responsibilities
A KPI framework with no named owner quietly dies. Welfare data becomes "everyone's job," which means it's nobody's. Assign it explicitly.
-
Stockperson / daily handler — owns continuous-event capture
deaths, treatments, water/feed checks, incidents. Logged same day, in the moment. This is the highest-volume, most fragile data, so it needs to be the easiest to record.
-
Herd/section manager — owns sampled metrics
body condition, lameness scoring, stocking checks. Owns the weekly review of continuous data and decides when a trigger has been hit. This person turns numbers into actions.
-
Farm owner / operations lead — owns the monthly rollup, the 90-day review, and sign-off on corrective actions. Reviews whether triggers actually led to changes. This is the layer auditors probe hardest, because it proves the system is managed, not just populated.
-
Vet (external, scheduled) — owns validation
reviews treatment and mortality trends, confirms welfare culls were justified, signs off health-plan alignment. Their independent notes carry enormous weight in an audit.
The handoff between stockperson and section manager is where most systems break. The stockperson logs a death but doesn't note a cause; the manager can't investigate a trend they can't see. Build the log so cause-of-death and basic context are required fields, not optional afterthoughts.
The 30/90/365-day evidence-pack template
This is what turns scattered records into an audit that goes smoothly. Assurance schemes think in windows: recent operational evidence, quarterly management evidence, and annual/systemic evidence. Organize your pack the same way and you stop scrambling.
30-day pack — "the farm is operating correctly right now"
-
Purpose
show current, live records. This is what the auditor reviews first because it proves the system is actually running, not reconstructed for the visit.
-
- Last 30 days of mortality and treatment logs with causes/reasons
-
- Daily water/feed check records
-
- Any incident or emergency-response entries with timestamps
-
- Current dashboard snapshot showing status and open actions
-
- Any excursion logs (temp/ventilation/water) with corrective notes
90-day pack — "we manage, review, and act"
-
Purpose
show the review-and-response cycle. This is where you prove triggers led to decisions.
-
- Three monthly rollups of every KPI
-
- Sampled-metric records (three rounds of BCS, around six rounds of lameness) with assessor noted
-
- Corrective-action log
what breached, what was done, who signed off, outcome
-
- Trend commentary — even a few honest lines ("lameness ticked up in month 2 after a wet spell, added footbath rotation, dropped by month 3")
-
- Vet review notes if within the window
365-day pack — "the system is stable and improving"
-
Purpose
show governance and trend over a full production cycle.
-
- 12-month trend for each KPI
-
- Annual welfare health-plan review with the vet
-
- Full welfare-cull log with justifications
-
- Evidence of any SOP or threshold changes and why they were made
-
- Staff training/calibration records (especially scoring calibration)
-
- Summary of the year's corrective actions and whether recurring issues got resolved
The mapping trick that makes this powerful: keep a simple index sheet listing each scheme standard clause, and next to it the exact record and pack window that satisfies it. When the auditor cites a standard, you flip to your index and pull the right document in seconds instead of hunting. This same clause-to-record mapping discipline is covered from the traceability angle in audit-ready traceability record templates and retention timelines, and the two systems share a lot of the same backbone.
A step-by-step build order
If you're starting from a messy pile of records, don't try to stand up all ten metrics at once. Sequence it:
-
Fix the continuous logs first — mortality, treatments, incidents. These are highest-value and most likely to be missing context. Add required cause/reason fields.
-
Attach triggers to those three. Decide the baseline and the action for each.
-
Add the daily exception checks — water, feed, environment. Cheap, fast, high audit value.
-
Layer in sampled metrics — start with body condition and lameness. Set the cadence, name the assessor.
-
Build the sampling calendar so overdue items surface automatically.
-
Stand up the corrective-action log as the single home for every trigger response.
-
Assemble the first 30-day pack from what you now have, then let 90 and 365 fill naturally over time.
Don't skip to step 4. Farms that start with fancy scoring before they've fixed basic event logging build a beautiful roof on no foundation.
A real scenario
A mixed beef-and-sheep operation, roughly 600 head across both, needed to get onto a retailer's assurance scheme to protect a supply contract worth a meaningful chunk of their annual income. Their first mock audit went badly — not because of animal condition, but because records were split across a wall calendar, a couple of notebooks, and one person's memory. The auditor flagged around a dozen gaps, mostly "you claim to do this, but you can't show it consistently."
They didn't add more monitoring. They cut it down to nine metrics, forced cause fields into the death and treatment logs, and set a fixed monthly condition-scoring day with the same person doing it each time. The sampling calendar was the real change — overdue items became visible instead of forgotten.
At the real audit about four months later, the difference wasn't the animals; the animals were fine both times. It was that every question had a dated record behind it, and the corrective-action log showed a wet-weather lameness spike getting caught and handled. They passed with a couple of minor observations instead of a dozen. The whole thing came down to provability, not practice.
When a compact framework makes sense (and when it doesn't)
When it makes sense: almost every farm entering or maintaining an assurance scheme, and any operation where welfare records are currently scattered or reconstructed after the fact. A tight, owned, cadenced set beats a sprawling one every time.
When it's a bad idea: if you genuinely have the labor and systems to run richer welfare monitoring and you actually use every metric to drive decisions, don't artificially shrink for its own sake. Some larger operations legitimately need finer-grained data. The compact set is a floor, not a ceiling.
Who should not bother yet: if your basic event logging — deaths, treatments, births — is still broken, don't build a welfare KPI dashboard on top of it. Fix the foundational records first. A welfare framework sitting on unreliable event data just produces confident-looking numbers that fall apart under one question.
Where software quietly helps
None of this requires software — you can run a compact welfare framework on well-designed spreadsheets and real discipline. But the parts that break most reliably by hand are the cadence and the linkage. Remembering that condition scoring is due, that a treatment spike should trigger a review, that a red status needs a dated corrective note before it can close — those are exactly the things that slip during lambing or a heat wave, which is precisely when welfare risk is highest.
This is where an operational platform with some AI-assisted automation earns its place: flagging overdue samples before they lapse, surfacing when a metric crosses its trigger, pulling continuous logs into the right evidence-pack window automatically, and keeping the clause-to-record index current so an audit becomes a lookup instead of a scramble. It's not about replacing the stockperson's judgment — it's about making sure the record of that judgment is always complete and always where the auditor expects it.
The framework is the important part. The tooling just keeps it alive during the weeks you're too busy to babysit it.
Bringing it together
An animal welfare KPI framework for a farm succeeds or fails on three things that have nothing to do with how well you treat your animals: whether the metric set is small enough to maintain, whether every metric has a cadence and a trigger, and whether your records fall naturally into the 30/90/365 windows an auditor thinks in. Get those right and the audit stops being an event you dread and becomes a report you can pull on demand.
Start compact. Fix the event logs. Attach triggers. Make sampling visible. Build the evidence pack in windows. The farms that pass cleanly aren't the ones doing the most — they're the ones who can prove, in seconds, that what they do is consistent, reviewed, and acted on.
An animal welfare KPI framework for a farm succeeds or fails on three things that have nothing to do with how well you treat your animals: whether the metric set is small enough to maintain, whether every metric has a cadence and a trigger, and whether your records fall naturally into the 30/90/365 windows an auditor thinks in. Get those right and the audit stops being an event you dread and becomes a report you can pull on demand.
Start compact. Fix the event logs. Attach triggers. Make sampling visible. Build the evidence pack in windows. The farms that pass cleanly aren't the ones doing the most — they're the ones who can prove, in seconds, that what they do is consistent, reviewed, and acted on.
Ready to optimize your farm management?
Join hundreds of farmers using Barnyly to save time, improve animal health, and increase farm productivity.