

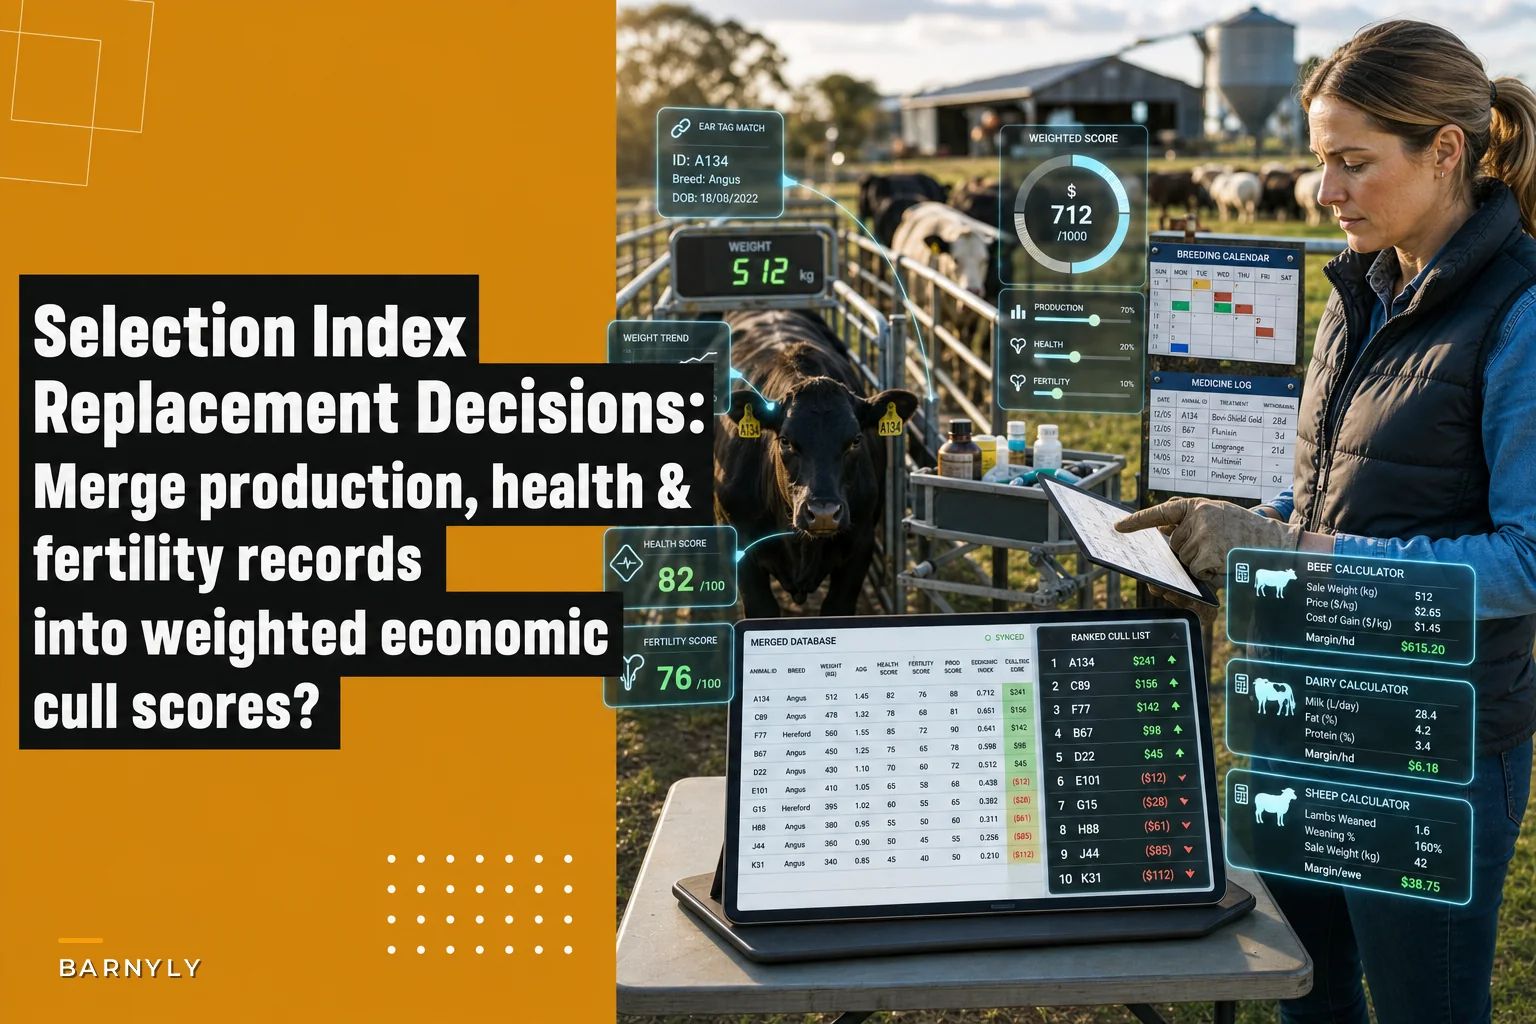

Most culling decisions on small and mid-size operations get made on gut feel and a couple of loud data points. The cow that scoured her calf. The ewe that came up open twice. The heifer that looks "a little rough." Meanwhile the quiet performers — the ones producing steadily, breeding back on time, never touching the vet — never get scored at all. They just blend into the herd.
That's the real problem with replacement decisions. It's not that farmers lack records. It's that the records live in separate places and never get converted into a single number you can rank animals by. Production sits in one notebook, health treatments in another, calving dates on the wall calendar. Nobody sits down and says "this cow is worth keeping and this one isn't" using the same yardstick across the whole herd.
A selection index fixes that. It takes the traits you actually care about — production, health, fertility — weights them by how much each one costs or earns you, and produces one score per animal. Then you rank, and you cull from the bottom against your replacement cost. This post walks through how to build those templates for beef, dairy, and sheep, with the actual math and simple calculators you can copy.
Why a single index beats trait-by-trait culling
The trap most people fall into is culling on one trait at a time. You pull the low milkers. Then separately you pull the ones with high somatic cell counts. Then the late breeders. By the time you've made three passes, you've either flagged half the herd or you've kept an animal that's mediocre at everything but never bad enough at any single thing to get cut.
Single-trait culling also punishes the wrong animals. A ewe that raised twins every year but had one mastitis case looks worse on a "health" pass than a single-raising ewe that stayed clean. But the twin-raiser is far more valuable. Only a weighted index catches that, because it lets a strong fertility score offset a health ding — the way your bank account actually experiences it.
The pattern worth noticing: on operations that cull trait-by-trait, herd average drifts sideways for years. On operations that rank by a combined index and cull the bottom 10–15% annually, you see measurable movement in whatever traits you weighted heaviest, usually within three to four calf or lamb crops.
The core idea: weight by dollars, not by preference
The mistake in a lot of homemade scoring systems is that people weight traits by how much they care about them emotionally, not by what those traits actually cost or return. Someone who's proud of their calving ease weights it at 40% even though, on their operation, a difficult calving costs maybe $80 in labor and the occasional loss — while an open cow costs a full year of feed with nothing to sell.
Simplify farm operations and enhance animal care.
Barnyly helps you organize, track, and manage every aspect of your farm operations seamlessly.
- Comprehensive livestock tracking
- Automated health alerts
- Feed and resource scheduling
No credit card required
-
An open cow
cost of carrying her a year minus salvage, often $600–$900 net depending on feed.
-
A retained calf or lamb sold
your average net margin per head.
-
A mastitis or lameness case
treatment cost plus discarded product, labor, and any yield drop.
-
Extra weaning weight
pounds times your price, minus the feed to get there.
Once every trait is in dollars, the weights fall out naturally. You're not guessing anymore. The animal that costs you the most across her record ranks lowest, and that's exactly the one you want gone.
This is also where tying the index to replacement cost becomes the whole point. A low score only matters relative to what it costs to replace that animal. If a replacement heifer costs $1,800 all-in, then culling a cow only makes sense if her expected forward drag is bigger than that gap. We'll build that into the calculator below.
Building the beef index
Beef cow-calf operations usually care about three buckets: fertility (does she breed back and calve on time), production (weaning weight of her calf), and health/soundness (feet, udder, temperament, treatment history). Fertility dominates in almost every honest analysis, because an open cow zeroes out everything else that year.
Here's a workable weighting for a commercial cow-calf herd. Adjust the dollar anchors to your own numbers.
| Trait | What you measure | Dollar anchor | Suggested weight |
|---|---|---|---|
| Calving interval / bred status | Days from ideal, or open flag | ~$700 net per open year | 45% |
| Weaning weight (adjusted) | 205-day adjusted, deviation from herd avg | ~$1.40/lb × deviation | 30% |
| Health/treatment record | Count of interventions, severity | $40–$150 per event | 15% |
| Soundness/structure | Feet, udder score 1–5 | Culling replacement cost risk | 10% |
How to turn a record into a score: convert each trait to a 0–100 scale where 100 is your best animal and 0 is your worst, then multiply by the weight. A cow that weans a calf 40 lbs above herd average, bred back on the first cycle, with no treatments and sound feet, ends up near the top. A cow that came up open scores a hard zero on the 45% fertility slice and can't recover no matter how good her calf was — which is correct, because there was no calf.
If you've already mapped breeding events cleanly, this gets much easier. There's a longer breakdown of that in why mapping the breeding lifecycle to records makes reproduction decisions predictable, and the fertility slice of your index is only as good as those breeding records.
Building the dairy index
Dairy shifts the weighting hard toward production and udder health, because those are your daily revenue and your biggest recurring cost. Fertility still matters — a cow that won't settle drags your whole calving pattern — but the dollar exposure lives in the tank and the SCC penalties.
-
Production (milk value adjusted for days in milk) 40%
-
Udder health / SCC history 25%
-
Fertility (days open, services per conception) 20%
-
Health events (lameness, ketosis, DA) 15%
The dollar anchors get specific fast here. An SCC that pushes a cow over your co-op's penalty threshold isn't just a health note — it's a direct check reduction and often discarded milk during treatment. A typical clinical mastitis case runs somewhere in the $250–$450 range once you count discarded milk, treatment, labor, and the yield she doesn't fully recover. That's why udder health carries a quarter of the whole index in dairy but only a smaller slice in beef.
The nice thing about dairy is your production data is usually already digital from the meter or DHIA. The gap is almost always health and fertility — those get scribbled and never make it into the same file as the milk weights. Which brings us to the real bottleneck.
The real bottleneck: getting all three data streams into one place
None of this math is hard. A spreadsheet handles it. The reason most operations don't run a selection index isn't the calculation — it's that the three inputs never sit in the same table on the same day.
-
Production data lives in one system (scale, meter, or notebook).
-
Health treatments live in the medicine log or the vet's paperwork.
-
Fertility lives on the breeding calendar or in your head.
To build one index score per animal, you have to join all three by animal ID, for the same time window. Every time you do it manually, someone has to re-key numbers, match ear tags, and hope nobody transposed a digit. On a 120-cow herd that's an afternoon of tedious lookup, which is exactly why it gets skipped for two or three years until a cull decision goes badly wrong.
This is where operational software earns its keep — not by making the decision for you, but by keeping production, health, and breeding records attached to the same animal record so the index calculates when you want to rank. When those streams stay joined, running your cull list becomes a five-minute filter instead of an afternoon of matching tags. The scoring logic is yours; the software just stops the data from scattering.
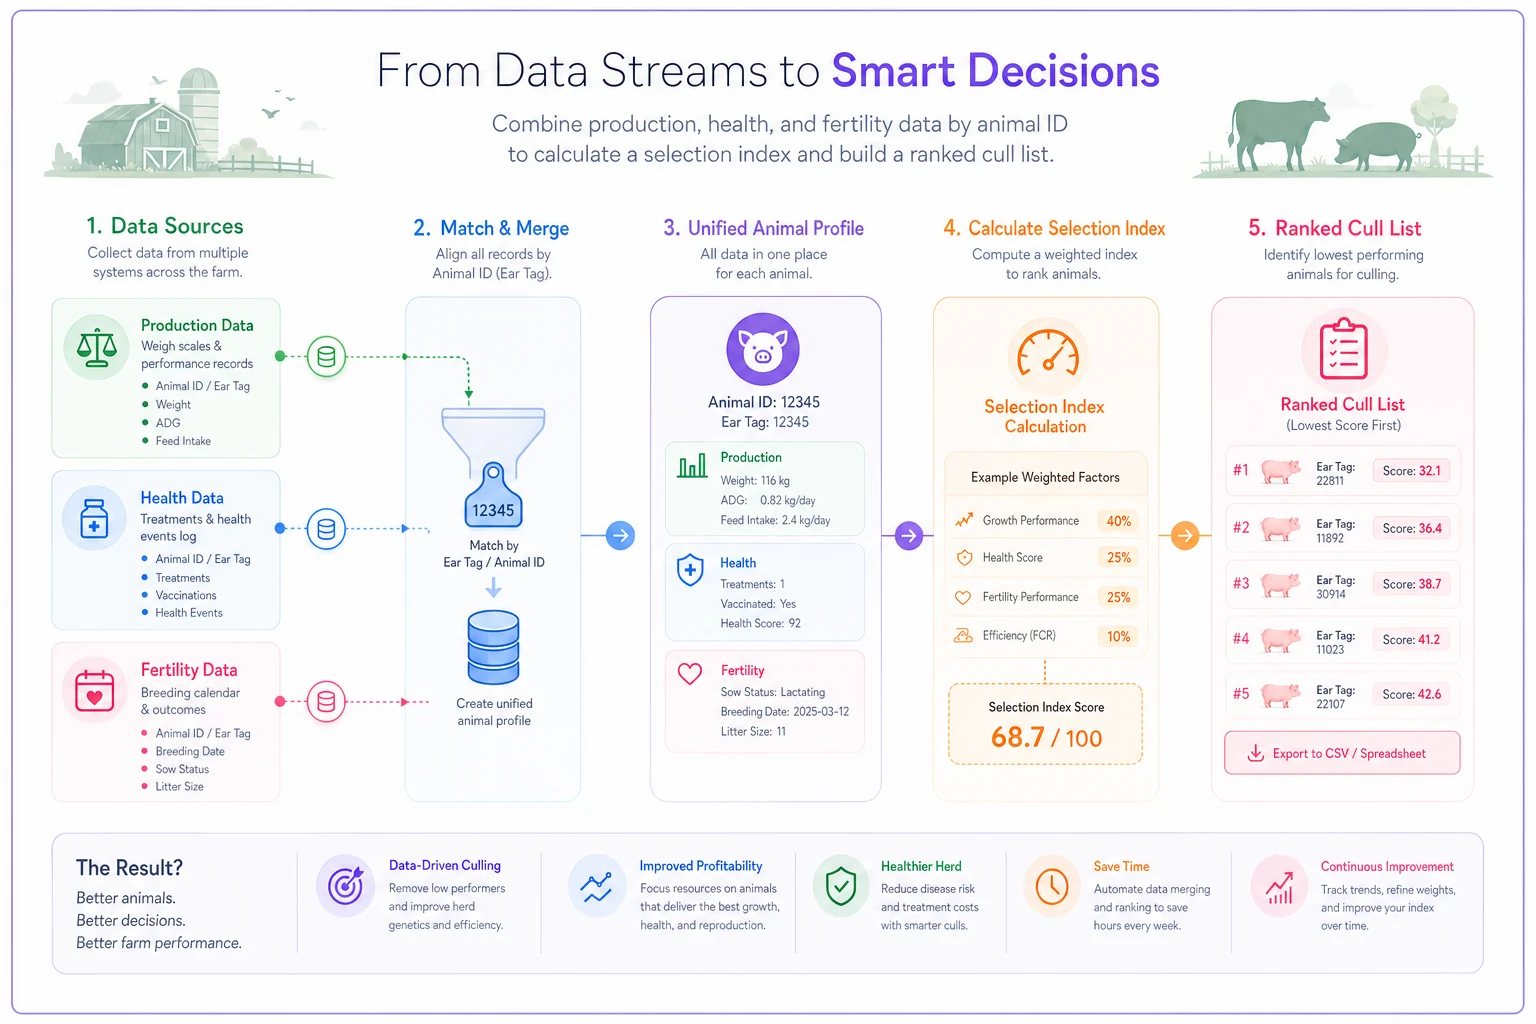
This diagram shows the simple workflow for joining the three streams into one joined table you can score.
Keep a consistent ear-tag or animal ID standard across all records to avoid re-keying during joins.
When those streams stay joined, running your cull list becomes a five-minute filter instead of an afternoon of matching tags.
Building the sheep index
Sheep flip the emphasis again. For most commercial flocks, prolificacy and lamb survival carry the index, because the number of lambs weaned per ewe joined is the single biggest driver of output. Wool matters on some operations, not at all on others.
-
Lambs weaned per ewe (prolificacy × survival) 45%
-
Weaning weight of lambs 25%
-
Ewe health (mastitis, lameness, dag/worm resilience) 20%
-
Soundness (feet, teeth, udder) 10%
The trait people consistently underweight in sheep is worm resilience. On operations dealing with drench resistance, ewes that need fewer treatments to stay in condition are worth real money in labor and chemical costs, and they tend to pass that hardiness on. If you're tracking FEC or drench frequency, fold it into the health slice — it's one of the few traits where the index genuinely shifts your future chemical bill.
Lamb survival is where the sheep index and your neonatal protocol overlap. A ewe with strong genetics who loses lambs at birth scores low on the prolificacy slice, and you have to decide whether that's her fault or a management gap. The index tells you which ewes to watch; your survival records tell you why.
A simple replacement-cost decision rule
The rule in plain terms: > Cull an animal when her expected forward cost — her drag over the next production cycle based on her index — exceeds the net cost of replacing her.
Worked example, beef:
-
A cow ranks in your bottom group. Her record suggests she's likely to be open again or wean a light calf — call her expected drag next year ~$550 versus your herd's median cow.
-
A replacement heifer costs $1,800 raised, and she'll take a year to produce.
-
Salvage on the cull cow is ~$1,000.
Net cost to replace = $1,800 − $1,000 = $800. Her expected annual drag is $550. In year one it's close, but that drag compounds — she'll likely repeat — so over two cycles the math clearly favors culling. Contrast with a cow whose drag is only $150: replacing her would cost you money. Keep her, even though she's below average.
This is the discipline the index enforces. Below average isn't automatically a cull. Below average by more than it costs to replace her is.
For anyone who wants to connect these per-animal decisions back to whole-operation cashflow, the approach in mapping herd events to your P&L pairs naturally with this — the index gives you the per-head score, the P&L view shows the aggregate effect of your cull decisions.
When a selection index actually makes sense
This isn't for everyone, and forcing it on the wrong operation wastes time.
It makes sense when:
-
You keep more than roughly 40–50 breeding females, enough that ranking matters.
-
You're retaining your own replacements and want directional improvement.
-
You already capture at least two of the three data streams reliably.
It's a bad idea when:
-
Your records are so patchy that the index would rank on noise. Fix record capture first; a confident score built on bad data is worse than gut feel.
-
You're running a tiny flock or herd where you genuinely know every animal — the index won't tell you anything you don't already know.
-
You're about to disperse or radically change your system anyway.
Who should not bother yet: operations where fertility isn't even being recorded. If you don't know who's open, you can't build the trait that carries 45% of the weight. Start with breeding records, run the index next season.
A quick real scenario
A cow-calf operation running about 90 head had been culling on "she looks poor" and open-cow status only. Weaning weights were recorded but never tied back to the dam beyond a rough mental note.
They built a beef index over one winter — fertility 45%, weaning weight 30%, health 15%, soundness 10% — using two years of records they already had, just scattered across different notebooks. The first ranking surprised them: three cows they'd have kept on looks landed in the bottom ten because their calves consistently weaned 30–50 lbs light despite the cows breeding back fine. Two cows they'd nearly culled for age ranked mid-pack because they still weaned heavy calves on time.
They culled the bottom eight against a replacement cost of roughly $1,700 net. The following year's calf crop weaned close to 20 lbs heavier per head on average — not dramatic, but on 82 calves at their price that was a few thousand dollars they wouldn't have captured otherwise, plus tighter calving because the retained cows bred earlier. Nothing fancy happened. They stopped ranking on the loudest trait and started ranking on the whole record.
Getting started without overbuilding it
You don't need a perfect system to start. You need one table, three columns of data joined by animal ID, and a set of weights anchored to your own dollars.
-
Pick your three trait buckets and assign weights that sum to 100%.
-
Anchor each weight to a real cost or return from your operation, not a preference.
-
Convert each animal's record to a 0–100 score per trait, multiply by weights, sum.
-
Rank the list, then apply the replacement-cost rule to set the cull line.
-
Re-run it every year with fresh records so the index compounds.
The hardest part isn't the math — it's keeping production, health, and fertility attached to the same animal so you can build the score without a re-keying marathon every fall.
Solve that once, and the selection index stops being a project and becomes a five-minute filter you run before every cull season. That's the difference between improving your herd on purpose and hoping it drifts the right way.
Ready to optimize your farm management?
Join hundreds of farmers using Barnyly to save time, improve animal health, and increase farm productivity.