


Most livestock operations run two completely separate worlds. There's the production world—vaccinations, breeding dates, weaning weights, treatment logs, feed deliveries. And then there's the money world—the accountant's spreadsheet, the year-end tax packet, the operating loan. These two worlds almost never talk to each other during the year. They meet once, in a rushed February meeting, where somebody tries to reconstruct what happened after the fact.
That gap is where per-head profitability disappears. You can have beautiful production records and still have no idea whether the $180 you spent on that pen of heifers turned into a gain or a loss, because the treatment cost lived in one binder and the sale receipt lived in another. A real livestock financial system isn't a fancier accounting package. It's a mapping problem: every event that happens to an animal needs to land in a finance bucket, tied to that animal or group, on the day it happens.
Get that mapping right and everything downstream gets easier—cashflow forecasting, cull decisions, replacement math, whether to buy that squeeze chute this year or wait. Get it wrong and you're flying on gut feel while telling yourself you're data-driven.
Why the two worlds stay disconnected
The disconnect isn't laziness. It's that production events and financial events have different natural rhythms, and nobody ever built a bridge between them.
Production happens continuously and in the field. A calf is born at 2am. A steer gets treated for pinkeye on a Tuesday. Feed shows up on a truck. These things get scribbled on a calendar, tapped into a notes app, or just remembered—badly. Financial recording happens on a completely different clock: when the invoice arrives, when the check clears, when the bookkeeper does the monthly reconciliation. By then the animal-level context is long gone. The feed invoice says "$4,200, 8 tons" but nobody links it back to which group ate it.
Part of it is just a people problem. The person doing the work in the pen isn't the person entering numbers into QuickBooks. Even on a one-person operation, the timing is off—you doctor cattle in the morning and maybe touch the books that evening, if at all. Information decays in that gap.
What you see across a lot of operations is that the ones with genuinely useful numbers aren't the ones with the most sophisticated software. They're the ones who decided, up front, on a small set of finance buckets and a rule for how every field event maps into one. That decision—made once—does more than any app.
The core idea: events map to buckets, buckets roll up to per-head P&L
Start with the buckets. Keep them boring and few. A workable structure for most cow-calf, stocker, or mixed operations:
Simplify farm operations and enhance animal care.
Barnyly helps you organize, track, and manage every aspect of your farm operations seamlessly.
- Comprehensive livestock tracking
- Automated health alerts
- Feed and resource scheduling
No credit card required
| Finance bucket | Example events feeding it | How it's assigned |
|---|---|---|
| Acquisition / opening value | Purchases, births (value at birth), transfers in | Per head or per group |
| Feed & forage | Hay, supplement, pasture lease, mineral | Per group, allocated by head-days |
| Health & treatments | Vaccines, antibiotics, vet calls, wormer | Per head where possible, else per group |
| Breeding & repro | Bull cost/amortization, AI, preg checks, semen | Per exposed female |
| Labor & yardage | Handling, feeding time, facility use | Per head-day |
| Death loss | Mortality, condemnation | Per head (as a loss against that animal's accumulated cost) |
| Revenue | Sales, cull sales, weaning transfers | Per head or per lot |
The trick most people miss: feed and labor almost never map cleanly per head, so you allocate by head-days. If a group of 40 head grazed a leased paddock for 60 days, that's 2,400 head-days. Divide the lease and supplement cost across those head-days, then attribute back to each animal based on how long it was in that group. It's not perfect, but it's honest—and it beats the alternative of pretending feed just disappears into a general expenses pile.
Once events are landing in buckets tied to animals or groups, per-head lifecycle P&L becomes arithmetic instead of archaeology. This is the same principle behind turning livestock records into predictable KPIs—the records only pay off when they're structured to answer a question you'll actually ask.
A worked per-head lifecycle P&L
Take one animal through it. Say a spring-born replacement-candidate heifer on a cow-calf operation. Rough numbers, deliberately uneven because real ones always are.
Opening value at birth: ~$650 (you can value at market weaned value or at accumulated dam cost; pick one method and stick with it).
-
Feed & forage (allocated head-days)
~$430
-
Health (vaccines, two treatments, preg check later)
~$74
-
Breeding/repro share (bull amortization across exposed females)
~$38
-
Labor & yardage (allocated)
~$95
-
Death loss reserve (spread across the group)
~$22
That's about $659 of accumulated cost on top of the $650 opening value, so roughly $1,309 all-in by the retention-decision point.
Now the fork. If she's bred and retained, that $1,309 becomes her opening cost as a replacement female and you keep the ledger running. If she's sold open at, say, ~$1,150, you just booked a per-head loss of around $160—and that number is the whole point. Without the mapping, you'd have sold her, seen $1,150 come in, and felt fine. The system tells you she cost more to produce than she brought.
Do this across a group and patterns emerge fast. A typical example: the top third of a calf crop carries almost all the margin, the middle third roughly breaks even, and the bottom third quietly loses money every year—usually the late-born, slow-gaining, chronically-treated animals. You can't fix what you can't see.
Event-driven cashflow: the calendar nobody builds
Profitability tells you if the operation works across a lifecycle. Cashflow tells you whether you survive until the lifecycle finishes. These are different problems, and livestock is brutal on the second one—costs are continuous and revenue arrives in a few big lumps.
An event-driven cashflow calendar is built off the same event stream, projected forward. Every recurring event has a cash signature and a rough date:
-
Breeding season → bull expense / semen / AI tech, spring
-
Calving → minimal cash out, but a labor spike
-
Branding/processing → vaccine and labor cost, early summer
-
Weaning → feed cost jump if backgrounding, or a revenue lump if selling
-
Preg check → vet cost, fall
-
Cull sales → revenue lump, fall
-
Feed buying → the big one, usually a fall/winter outlay for hay
-
Operating loan interest → quarterly or at renewal
The failure pattern is predictable: operations forecast revenue confidently—they know roughly when calves sell and what they'll weigh—but forecast costs only vaguely. So they get surprised in December when the hay bill, the loan interest, and the mineral order all land in the same three weeks, right when no revenue is coming in. That's not a bad year. That's a bad calendar, and it repeats annually because nobody wrote it down as a system.
The fix is to lay revenue and cost events on the same timeline and look for the gaps. Where's the longest stretch of cash-out with no cash-in? That's the window your operating line has to cover, and it's the number your banker actually cares about.
A simple process to build yours
-
List every recurring event that moves money, tagged with its typical month.
-
Attach a dollar range to each (use last year's actuals, not hopes).
-
Line them up month by month and total the net for each month.
-
Find your deepest cumulative cash trough across the year.
-
Size your operating credit or cash reserve to that trough plus a cushion.
-
Re-run it whenever herd size or a major input price shifts.
Six steps, done once a year in an afternoon, and it prevents the single most common cause of forced, badly-timed sales.
A visual workflow helps—here's a simple illustration.
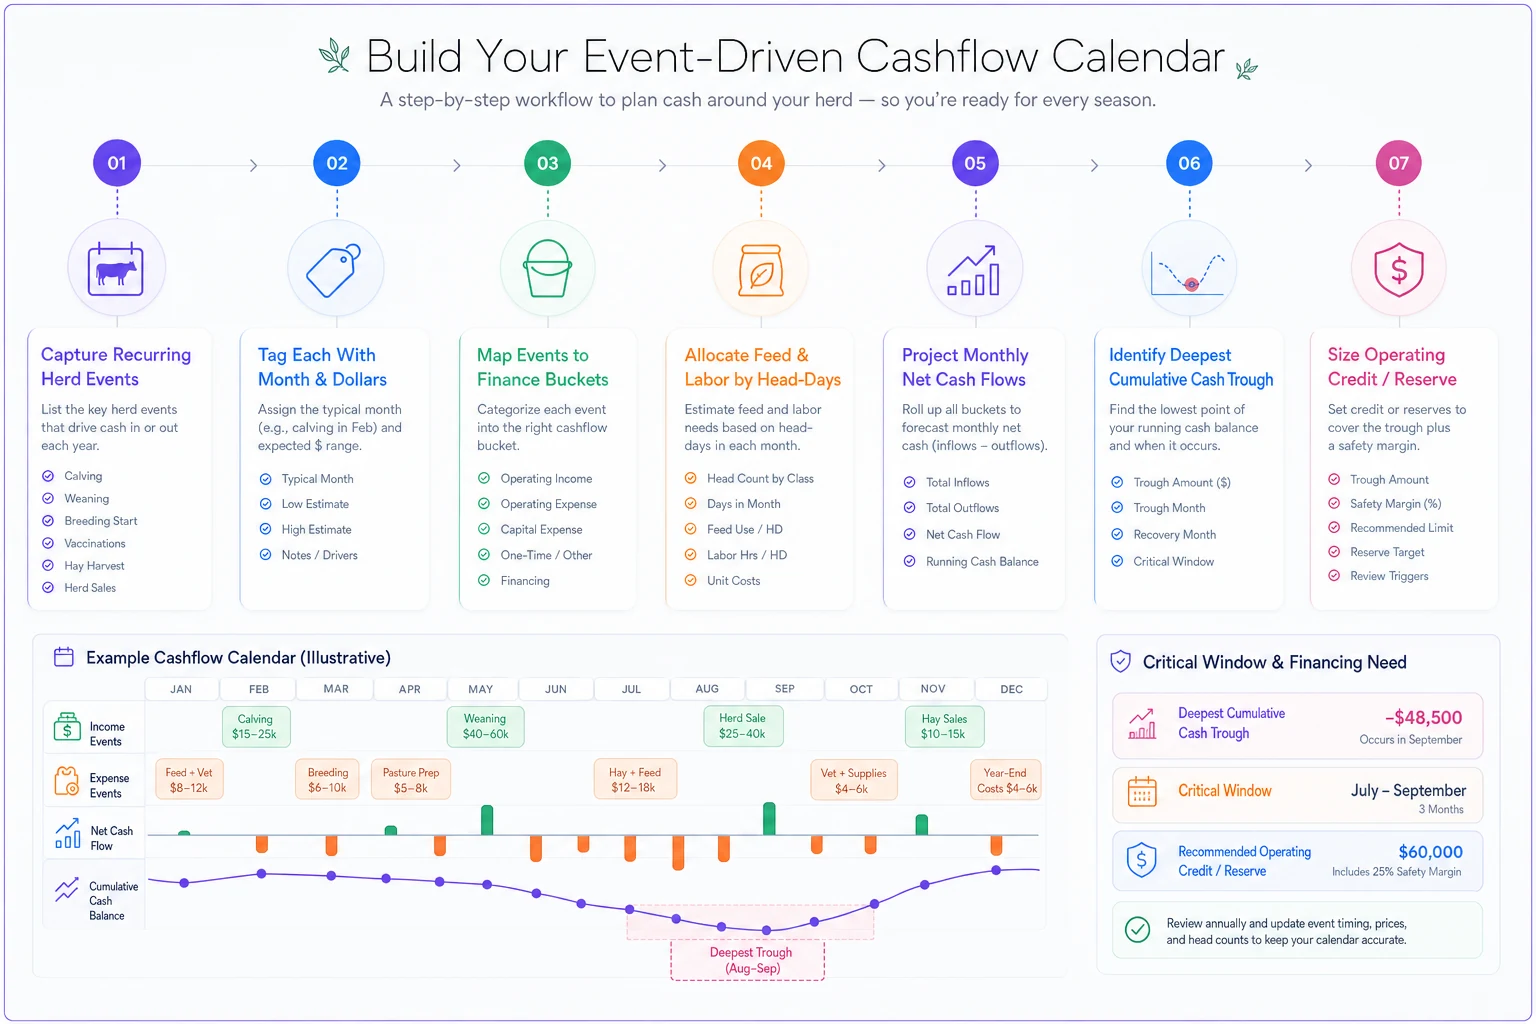
The failure pattern is predictable and the fix is actionable once you can see the calendar.
Decision thresholds: culling, replacement, and investment
This is where the mapped data actually earns its keep. Once you have per-head lifecycle numbers, you can set thresholds in advance instead of arguing about individual animals in the chute.
Culling thresholds. A cow that's produced below-average weaning weights two years running, been open once and marginal once, or accumulated treatment costs above a set ceiling—these become rule-based, not emotional. A useful pattern: rank the cow herd by lifetime net contribution and set a floor. Anything that's spent more than roughly 18 months below that floor with no clear explanation gets flagged for the cull list. The data removes the "but she's a good old girl" negotiation.
Replacement thresholds. The replacement decision is really a comparison: keep-and-develop cost versus buy cost versus the productive value each option brings. If developing a heifer to first calf runs $1,300–$1,500 all-in and comparable bred replacements are available for less in a given market, the math says buy. Most operations don't run this comparison because they don't know their true development cost—which loops right back to the per-head mapping. Tying breeding events to records is what makes this calculable at all; there's more on structuring that side in the piece on mapping the breeding lifecycle to records.
Investment thresholds. Should you buy the new handling system, the second water source, the grain bin? Frame it against the events it changes. A better chute that cuts processing labor and reduces injury shows up as lower labor allocation and lower death loss per head. If it saves somewhere around $6–$9 per head across a few hundred head annually, the payback period becomes calculable instead of a coin flip. The discipline is forcing every capital ask to name which finance bucket it moves and by how much.
A quick checklist before any big herd-level decision
-
Do I know the per-head accumulated cost for the animals involved?
-
Where does this decision hit the cashflow calendar—during a trough or a surplus?
-
What finance bucket does this change, and by roughly how much per head?
-
Have I set the threshold before looking at the specific animals?
-
Does this decision assume a market price I can actually defend?
Use the checklist to keep decisions disciplined and defensible.
A real scenario
A stocker/backgrounding operation running about 260 head at a time had decent production records but booked everything financially in three lumps: cattle bought, feed, cattle sold. Their year-end always showed a modest profit, so they assumed the whole thing was working evenly.
When they rebuilt records to map feed and health costs by group and by head-days, the picture changed. Two of their purchase lots—bought cheap in a fast market—had come in lighter and sicker than they'd registered at the time. Those lots carried roughly double the treatment cost per head and gained slower, so yardage and feed piled up. On paper, those two groups lost somewhere in the range of $40–$70 per head while the healthier lots carried the whole operation.
Nothing about their total profit had flagged a problem. The mapping surfaced it. The next buying season they set a hard threshold on purchase weight and health condition, walked away from two "cheap" lots that fit the old losing profile, and their per-head margin tightened up noticeably by fall. Same operation, same acres, better decisions—because events finally connected to buckets.
When this level of system makes sense (and when it doesn't)
When it's worth it: You're running enough head that per-head differences add up to real money, you're making retention and buying decisions regularly, or you're carrying an operating loan and need defensible cashflow projections. Growing operations especially—because the moment you scale, the "I keep it in my head" approach silently stops working and you often don't notice until a decision already went wrong.
When it's overkill: A handful of animals, mostly a lifestyle or supplemental operation, no financing pressure. Building full per-head lifecycle P&L for eight head is effort chasing pennies. A simple whole-herd tally is fine there.
Who should not start here: If your production records themselves are a mess—dates missing, treatments unlogged, no consistent animal IDs—fix that first. A financial mapping layer built on unreliable event data just produces confident-looking wrong answers, which is worse than knowing you don't know.
Where the software layer quietly helps
None of this requires software. Plenty of good operators run it on a well-designed spreadsheet with consistent discipline. But the real pain point is a data entry and timing problem—and that's exactly where an operational platform earns its place. When treatment logs, feed deliveries, birth records, and sales all get captured once—at the event, in the field—and the system handles head-day allocation and bucket mapping in the background, you skip the February reconstruction entirely.
Capture events in the field once and let the system allocate head-days and route costs automatically to avoid later reconstruction.
The useful version of this isn't a dashboard that dumps charts on you. It's the automation of the boring middle step: taking the event you already recorded and routing it to the right finance bucket, tied to the right animal, without a second entry. AI-powered operational platforms are genuinely good at the allocation grunt work—spreading feed cost across head-days, flagging animals crossing your cull thresholds, updating the cashflow calendar as events actually happen versus what you projected. That's leverage, not magic. The judgment stays yours; the bookkeeping-in-the-gap stops eating your evenings.
Operations that know their per-head numbers aren't smarter or better funded than the ones that don't. They just made one structural decision early: every event that touches an animal has a home in the finances, assigned the day it happens, not reconstructed months later.
Buckets, head-day allocation, a cashflow calendar built off real events, and thresholds set before the chute—that's the whole system. Build that bridge between the production world and the money world, and the hard decisions—cull, keep, buy, invest—stop being arguments and start being arithmetic. Which is exactly what you want when you're standing in the alley at weaning trying to decide what stays and what loads out.
Ready to optimize your farm management?
Join hundreds of farmers using Barnyly to save time, improve animal health, and increase farm productivity.