



The moment you try to compare two farms, the numbers start lying to you.
A 92% weaning rate sounds great until you realize it's measured against females exposed on one operation and females confirmed pregnant on another. A feed conversion number looks competitive until you find out the neighbour's figure excludes creep feed and yours doesn't. Average daily gain reads beautifully on paper, then you discover one ranch weighs off the truck at 6am empty and the other weighs full-gut mid-afternoon.
This is the quiet problem behind most cross-farm KPI normalization livestock work: the denominators don't match, the measurement moments don't match, and the animal classes buried inside the average don't match. Benchmarking only works when two numbers actually describe the same thing. Most of the time, they don't.
If you've already built internal dashboards — and if you haven't, the groundwork in Stop guessing herd performance: a livestock KPI and dashboard playbook is the right place to start — this article is the next layer. It's about making your numbers portable: comparable against peers, your region, and a formal scheme without quietly fooling yourself.
The three ways benchmarks go wrong before you even start
Before getting into formulas, it helps to name the failure modes. Almost every bad comparison traces back to one of these three.
Definition drift. The same metric name hides different math. "Mortality" might mean deaths as a share of opening inventory, closing inventory, or average inventory over the period. Each gives a different answer on the same dead animals.
Mixed denominators. Per-head, per-acre, per-AU, per-kg-produced — people quote whichever makes them look best, often without saying which. A stocking rate "per acre" is meaningless until you know whether that's grazable acres or titled acres including the yard, the dam, and the scrub block.
Class contamination. A single herd average blends first-calf heifers, mature cows, and cull-track animals. Two farms with identical mature-cow performance can show wildly different "herd" averages purely because of how many young or old animals sit in the mix.
The fix isn't more dashboards. It's a shared definition layer underneath them — canonical definitions, agreed normalization formulas, and a benchmarking process that explicitly states what's being held constant.
Canonical metric definitions: pin the math before you compare
A canonical definition is just the version everyone agrees to use when comparing. You can measure however you like internally — but the moment a number leaves your gate for comparison, it should be converted to the canonical form.
Simplify farm operations and enhance animal care.
Barnyly helps you organize, track, and manage every aspect of your farm operations seamlessly.
- Comprehensive livestock tracking
- Automated health alerts
- Feed and resource scheduling
No credit card required
For each metric, lock down four things:
-
The numerator — exactly what's counted (deaths? weaned calves? kilograms sold?).
-
The denominator — exactly what it's divided by (exposed females? average inventory? grazable hectares?).
-
The measurement moment — when and under what conditions the value is captured (weaning day, 200-day adjusted, off-truck empty weight).
-
The exclusions — what's deliberately left out (purchased animals, agisted stock, trial groups).
A few canonical definitions worth standardising across any multi-farm comparison:
| Metric | Canonical numerator | Canonical denominator | Common distortion to avoid |
|---|---|---|---|
| Weaning rate | Calves/lambs weaned | Females exposed to breeding | Using pregnancy-confirmed females inflates it |
| Mortality rate | Deaths in period | Average inventory over period | Opening-only inventory understates loss in growing herds |
| ADG | End weight − start weight | Days on feed/grazing | Mixed gut-fill states at weigh-in |
| Stocking rate | Total animal units carried | Grazable area only | Counting total titled area dilutes it |
| Feed cost per kg gain | Total feed cost | Total kg liveweight gain | Dropping creep or supplement feed |
| Pregnancy rate | Confirmed pregnant | Females exposed | Counting only females that cycled |
The point of the table isn't the specific choices — some regions standardise differently. The point is that you write them down once and everyone converts to the same form. Once definitions drift between sites, every downstream comparison inherits the error.
Normalization formulas: per-head, per-acre, and class-adjusted
Normalization is where raw records become comparable. Three normalization families cover most livestock work.
Per-head normalization
Average inventory = (opening head + closing head) / 2 Per-head metric = total outcome / average inventory
A farm that grew from 400 to 600 head over the season has an average inventory of 500. If you quietly use the opening 400, your per-head mortality looks nearly 20% worse than reality. In fast-growing or heavily traded herds, the denominator choice alone can swing the number more than any real management difference.
Per-acre (per-hectare) normalization
Grazable area = total area − non-grazable area Per-acre metric = total output / grazable area
A 1,000-acre block with 180 acres of scrub, dam, and infrastructure has 820 grazable acres. Benchmarking production across the full 1,000 makes a well-run operation look under-stocked and a poorly-run one look efficient. Always ask the question nobody asks: grazable or titled?
Class-adjusted normalization
This is the one most farms skip, and it's the one that fixes the most lies. Instead of one blended herd average, you weight each animal class to a standard reference mix, so differences in herd composition stop masquerading as performance differences.
-
Split the herd into classes (e.g. first-calf heifers, mature cows, aged cows).
-
Calculate the metric within each class.
-
Apply a fixed, agreed reference weighting across all farms.
-
Sum the weighted class values into one class-adjusted figure.
A quick normalization workflow:
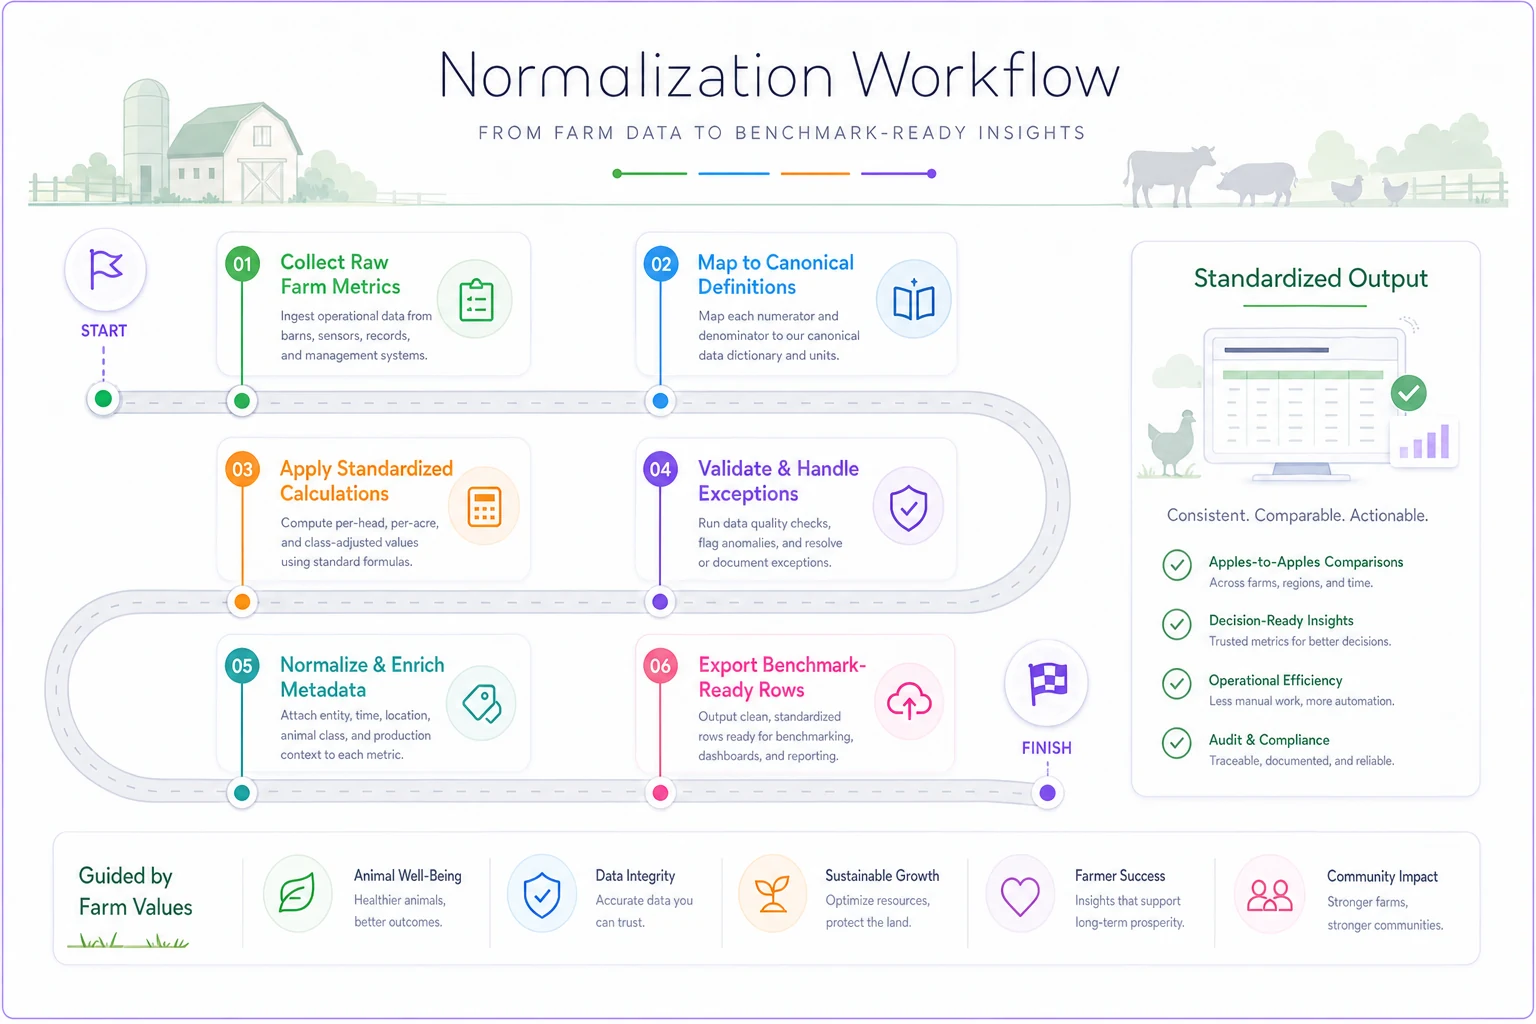
This shows the main steps to convert raw farm records into comparable metrics.
A worked example makes this concrete. Two farms report weaning rates:
-
Farm A — 60% heifers at 78%, 40% mature cows at 91% → raw average ≈ 83%
-
Farm B — 20% heifers at 80%, 80% mature cows at 90% → raw average ≈ 88%
On raw numbers, Farm B looks clearly better. Apply a fixed reference mix of 30% heifers / 70% mature cows to both:
Farm A class-adjusted = (0.30 × 78) + (0.70 × 91) = 87.1%
Farm B class-adjusted = (0.30 × 80) + (0.70 × 90) = 87.0%
Nearly identical. Farm B's apparent advantage was almost entirely herd composition — fewer first-calvers dragging the average down — not better management. Without class adjustment, Farm A gets told to fix a problem it doesn't have, and Farm B gets praised for a result it didn't earn.
This is the single biggest reason internal and external benchmarks disagree. The welfare-side version of the same discipline shows up in the audit-ready animal welfare KPI framework for livestock farms, where class and cohort context changes whether a figure is a red flag or normal variation.
The three-tier benchmarking process: peer, regional, scheme
Once definitions and normalization are set, comparison runs in three tiers. Each answers a different question, and mixing them up is where interpretation falls apart.
Tier 1 — Peer benchmarking
Compare against a handful of similar operations: same species, broadly similar system, similar climate zone. This tier is the most actionable because the group is small enough to actually understand why someone's ahead.
The failure here is picking "peers" who aren't. A grass-finishing operation benchmarked against a feedlot-backgrounding system will always look worse on gain and better on cost, and neither number means anything. Peer selection criteria should be written down explicitly, not chosen on instinct.
Tier 2 — Regional benchmarking
Compare against a broader regional dataset — dozens to hundreds of farms. You're not looking for who's best here, you're looking for where you sit in the distribution. Percentile position (top quartile, median, bottom quartile) matters more than the absolute number.
The key discipline: never compare your raw figure to a regional normalized figure. If the regional set is class-adjusted and per-grazable-acre, your number has to be too. This is the most common mistake — people drop their raw farm number next to a carefully normalized regional median and draw conclusions from an artefact.
Tier 3 — Scheme benchmarking
Compare against a formal scheme or standard — an industry program, a processor's grid, a certification threshold. These usually come with their own mandated definitions, which may differ from your canonical ones. The job here is translation: converting your canonical figure into the scheme's required form, documenting the conversion, and keeping both versions on file.
| Tier | Comparison group | Question it answers | Main risk |
|---|---|---|---|
| Peer | 3–10 similar farms | Who's ahead and why? | Non-comparable peers |
| Regional | Dozens–hundreds | Where do I sit in the distribution? | Raw vs normalized mismatch |
| Scheme | Formal standard | Do I meet the required threshold? | Definition translation errors |
Run them in that order. Peer tells you what's achievable in your conditions. Regional tells you whether your whole peer group is good or bad. Scheme tells you whether you clear a hard line.
A clean export-ready template
The reason benchmarking collapses in practice isn't the math — it's that every farm stores numbers differently, so assembling a comparison means a week of manual reconciliation. An export-ready template fixes this by forcing every figure into the same shape before it leaves the farm.
-
Farm ID (anonymised if shared)
-
Metric name (canonical)
-
Period start / period end
-
Numerator value
-
Denominator type (per-head / per-acre / class-adjusted)
-
Denominator value
-
Normalized result
-
Class mix used (if class-adjusted)
-
Exclusions noted
-
Measurement moment
Before any number leaves your gate for comparison, work through this checklist in order:
-
Metric converted to the canonical definition.
-
Denominator type stated explicitly — never implied.
-
Average inventory used, not opening-only, for per-head figures.
-
Grazable area used for per-acre figures.
-
Reference class mix applied if class-adjusted.
-
Exclusions documented — purchased, agisted, and trial animals.
-
Measurement moment recorded, including weigh conditions and adjustment basis.
-
Period dates attached.
If a row can't tick all eight, it isn't ready to benchmark. It's just a number with no context — and context-free numbers are exactly how farms end up chasing problems that aren't real.
A real scenario: two cattle operations, one misleading gap
A backgrounding operation running around 520 head was told by its processor's regional report that its feed cost per kg of gain sat roughly 18% above the regional median — enough to trigger a serious "why are we so inefficient" review and a plan to cut supplement.
When the numbers were rebuilt to the canonical definition, two things surfaced. First, the regional median excluded purchased backgrounder feed from the numerator for animals on a certain program, while this farm included everything. Second, the regional figure was class-adjusted to a standard mix, while the farm's raw number blended in a batch of lighter, less efficient young cattle it had taken on cheaply that season.
After converting to the same canonical definition and applying the same class mix, the real gap shrank to around 4–6% — ordinary seasonal variation, not a structural problem. Cutting supplement, which was the original plan, would have quietly lowered gain and made the true per-kg cost worse. The "inefficiency" was a definition-and-class artefact, not a management failure.
That's the whole case for this work in one story. The farm didn't need to change how it fed cattle. It needed its numbers to mean the same thing as the numbers it was being judged against.
When this makes sense — and when it doesn't
When it's worth the effort:
-
You run multiple sites and want internal figures that are actually comparable across them.
-
You're being benchmarked externally by a processor, scheme, or lender and the comparison affects pricing or decisions.
-
Your herd composition shifts a lot year to year — lots of trading, changing heifer ratios — making raw averages unstable.
When it's overkill:
-
A single small herd with stable composition and no external benchmarking pressure. If you're only comparing yourself to yourself year over year, consistency matters more than canonical normalization — just don't change your own definitions mid-stream.
-
Metrics where you have too few animals per class for class-adjustment to be meaningful. Weighting a class of three animals to 30% of a reference mix produces noise, not insight.
Who should not bother yet: anyone whose underlying records still live in disconnected notebooks and spreadsheets with no agreed definitions. Normalization amplifies whatever's underneath it. Clean, consistently-defined records come first; comparison math comes second.
Where software quietly does the heavy lifting
None of this requires special tooling in principle. In practice, the manual version falls apart the moment you have more than two farms or more than a handful of metrics, because every comparison means re-deriving averages, re-splitting classes, and re-checking which denominator someone used.
This is the natural place for an AI-assisted operational platform to carry the repetitive load — not by making decisions for you, but by holding the canonical definitions in one place, converting every farm's raw records into the same normalized form automatically, and flagging when a denominator looks inconsistent. Export-ready rows that already tick the eight-point checklist. When the class mix changes, the class-adjusted figures recompute instead of waiting for someone to redo the weighting by hand.
Keep the canonical definitions in a single, version-controlled file so conversions remain auditable and reproducible.
The value isn't automation for its own sake. It's that the definition layer stops living in one person's head and one fragile spreadsheet, so a comparison that used to take a week of reconciliation becomes something you can actually trust on a Tuesday afternoon.
The bottom line
Benchmarking fails quietly. The numbers look comparable, the gaps look real, and farms make expensive changes based on artefacts of measurement rather than genuine performance differences. The fix is unglamorous but reliable: pin the canonical definitions, normalize deliberately — per-head, per-acre, and class-adjusted — and run comparisons through the peer, regional, and scheme tiers in that order, always matching normalized to normalized.
Do that, and a benchmark stops being a number someone waves at you and becomes something you can actually act on. The farms that get the most out of cross-farm comparison aren't the ones with the best raw figures. They're the ones whose figures actually mean what they say.
Ready to optimize your farm management?
Join hundreds of farmers using Barnyly to save time, improve animal health, and increase farm productivity.