


Most livestock carbon accounting fails for a boring reason: the numbers live in a different world than the operation. Herd records sit in one system (or a stack of notebooks), feed invoices in another, manure logs somewhere nobody's touched since the last nutrient management plan, and then once a year someone stitches it all into a spreadsheet nobody can actually defend when a buyer or auditor asks "where did this figure come from?"
That gap is the whole problem. If your emissions report can't be traced back to a dated record — a delivery ticket, a weigh sheet, a paddock move — it isn't accounting. It's an estimate wearing a suit.
This article walks through how to structure your operational records so GHG and nutrient numbers fall out of the work you already do. Which records map to which protocol inputs, worked calculation templates you can actually run, logs that survive verification, and a reporting cadence that lines up with your herd calendar instead of fighting it.
The three data streams that actually drive your numbers
Almost every livestock emissions figure traces back to three operational streams. Get these tracked cleanly and you've done roughly 80% of the work.
Enteric fermentation — this is the big one for ruminants, usually 50–70% of a beef or dairy operation's footprint. It's driven by dry matter intake, diet quality, and animal category (lactating cow vs. dry cow vs. growing steer). The inputs come straight from feed records and headcounts by class.
Manure management — driven by animal numbers, manure system type (pasture deposition vs. slurry vs. solid stack vs. lagoon), and how long manure sits before land application. Methane and nitrous oxide both come out of this stream, and the system type matters enormously — a covered lagoon and an open one produce wildly different numbers from the same animals.
Feed and inputs (upstream + on-farm N) — purchased feed carries embedded emissions, and nitrogen applied to pasture or crops (whether synthetic or from manure) drives nitrous oxide. This is where your fertilizer records and manure application logs double as carbon data.
Worth noticing: every single one of these inputs is something you're already recording for a completely different reason. Feed intake for cost control. Headcounts for inventory. Manure for nutrient management. Nobody needs to invent new data collection — they need to stop letting those records live in separate silos.
If you've already built out manure tracking for fertilizer value, you're most of the way to the manure emissions inputs. The same delivery volumes, storage duration, and application rates from a practical manure nutrient tracking system feed directly into the manure methane and N₂O calculations. Same numbers, different lens.
Mapping operational records to protocol inputs
Different protocols — IPCC Tier 1/2, GHG Protocol Agricultural Guidance, and most buyer-specific programs built on top of them — ask for the same underlying operational data. The trick is knowing which record answers which question.
Simplify farm operations and enhance animal care.
Barnyly helps you organize, track, and manage every aspect of your farm operations seamlessly.
- Comprehensive livestock tracking
- Automated health alerts
- Feed and resource scheduling
No credit card required
| Protocol input | Operational record it comes from | How often it changes |
|---|---|---|
| Animal numbers by category | Herd inventory / daily headcount | Daily (births, deaths, sales, moves) |
| Average liveweight by class | Weigh sessions, sale weights | Monthly / at events |
| Dry matter intake | Feed delivery + ration records | Weekly ration changes, seasonal |
| Diet digestibility / quality | Feed analysis (forage tests, tags) | Per feed lot / per season |
| Manure system type & retention | Facility description + management log | Rarely (setup); annual review |
| N applied (synthetic + manure) | Fertilizer purchases, spreader logs | Seasonal application windows |
| Days on pasture vs. confinement | Paddock move log / grazing calendar | Continuous |
| Purchased feed quantities | Feed invoices / delivery tickets | Per delivery |
The column that trips people up is the far right one — how often it changes. Animal numbers change daily. Diet quality changes seasonally. Manure system type barely changes at all. If you treat everything as an annual data-gathering exercise, you're forced to reconstruct daily and weekly changes from memory or averages, and that's exactly the reconstruction verifiers push back on.
In practice, this usually breaks when someone tries to back into "average herd size for the year" from a January and December count. If you sold 40 head in March and bought 30 replacements in October, a two-point average is wrong — and it's wrong in a way that's obvious to anyone who pulls your sale records. Animal-days is the honest unit, and animal-days only exists if you're logging events as they happen.
Worked calculation templates
These are simplified templates — your specific protocol may use different emission factors — but the structure is what matters, because it shows exactly which record each number pulls from.
Template 1: Enteric methane (Tier 2 style)
-
Pull average daily dry matter intake per animal class from ration records. Say your growing steers average 8.2 kg DM/day.
-
Convert to gross energy intake. DM × ~18.45 MJ/kg gives gross energy. 8.2 × 18.45 ≈ 151 MJ/day.
-
Apply the methane conversion factor (Ym) for the diet — typically 6.5% for forage-based, lower for higher-grain diets. 151 × 0.065 = 9.8 MJ/day as methane.
-
Convert energy to mass. Divide by the energy content of methane (~55.65 MJ/kg): 9.8 ÷ 55.65 ≈ 0.176 kg CH₄/day.
-
Scale by animal-days. If you ran, on average, 180 steers across 210 grazing days = 37,800 animal-days. × 0.176 ≈ 6,653 kg CH₄.
-
Convert to CO₂e. × 28 (GWP100) ≈ 186 tonnes CO₂e for that group.
Notice step 5. It doesn't ask for "how many steers do you have." It asks for animal-days, which only exists if births, deaths, sales, and moves are dated in your records. That single discipline is what separates a defensible number from an argument.
Template 2: Manure management methane
-
Volatile solids excreted = intake × (1 − digestibility) × ash factor. Higher intake and lower-quality diets = more VS.
-
Apply the methane conversion factor for your storage system. Pasture deposition might be ~1%, a solid stack ~4%, an uncovered warm-climate lagoon 60–80%. This single factor can swing your manure number by 50x.
-
Multiply through VS × max methane potential (Bo) × MCF × animal-days.
The operational insight here: your storage decision is a carbon decision. An operation that lets manure sit in an open pit through summer before spreading produces dramatically more methane than one that stacks and applies within a tight window. The log that proves your retention time — dates in, dates out — is doing double duty as a carbon control and as the record your nutrient plan already needs.
Template 3: Nitrous oxide from applied N
-
Total N applied = synthetic fertilizer N + manure N (from your manure analysis and application logs) + N deposited directly on pasture by grazing animals.
-
Direct N₂O = total N × emission factor (often ~1% as N₂O-N, though this varies by region and protocol).
-
Convert N₂O-N to N₂O (× 44/28), then to CO₂e (× 265).
If you already know the nutrient content of your manure from the fertilizer-value work, the N figure is sitting right there. The manure you're crediting as fertilizer savings is the same manure generating the N₂O line — same record, two outputs.
Verification-ready logs: what auditors actually check
A verifier isn't checking whether your math is clever. They're checking whether each number ties to a dated, independent record. The most common rejection isn't a wrong formula — it's a number that can't be traced.
Checklist for keeping logs verification-ready:
-
Every animal count is event-derived, not point-in-time. Births, deaths, purchases, sales, and transfers each dated. Animal-days computed, not estimated.
-
Feed records tie to invoices or delivery tickets. Quantities reconcile against what you paid for. A verifier will spot-check: does the DM intake you claim match the tonnage you actually bought?
-
Feed quality has a source. A forage test report, a feed tag, or a documented assumption with a citation. "We assumed 65% digestibility" needs a reason.
-
Manure system type and retention documented with dates. When was the pit emptied? When was manure applied? A management log, not a description.
-
N application logged by field, date, rate, and source. Spreader records or a simple field log. Both synthetic and manure N.
-
Emission factors cited to a version. IPCC 2019 refinement vs. 2006, which GWP set, which regional factor. Version drift is a real audit finding.
-
A clear boundary statement. What's in scope, what's excluded, and why. Verifiers reject reports with fuzzy boundaries more often than they reject reports with imperfect data.
The pattern across failed verifications is almost always the same: the operation did the work but couldn't prove the work happened when they said it did. Timestamps and independent corroboration — an invoice, a lab report, a signed log — are what separate a passing report from a rejected one.
Buyer-reporting cadence mapped to the herd calendar
Buyers — processors, retailers, offset programs — increasingly want emissions data on their schedule, not yours. The mistake is treating this as an annual scramble. The fix is mapping reporting checkpoints to events that already happen in your herd calendar.
Quarterly (light-touch data confirmation):
-
Reconcile feed purchases against ration records for the quarter.
-
Confirm animal-day totals from event logs.
-
Flag any manure storage changes or N application windows.
At major herd events (calving, weaning, sale groups):
-
Lock in liveweight data at weigh sessions.
-
Close out animal-day counts for groups that leave the operation.
-
This matters because groups sold mid-year need their partial-year animal-days captured before they're gone and the weights forgotten.
Annually (full report assembly):
-
Run all three calculation templates on the year's locked data.
-
Compile the verification pack
logs, invoices, feed tests, factor citations.
-
Compare year-over-year — a sudden swing usually points to a data problem, not a real change.
This cadence works because it never asks you to remember anything. Each checkpoint captures data while it's still fresh and still independently verifiable. By the time the annual report is due, assembly is a matter of pulling locked numbers — not a two-week reconstruction project.
It also ties directly into how you already think about herd events flowing into financial outcomes. If you've built the discipline of mapping herd events to your P&L, you've already got the event backbone. Carbon reporting rides on the same events — a sale that hits your cashflow also closes an animal-day count and a liveweight record.
A real scenario: cow-calf operation, 220 head
A cow-calf operation running around 220 breeding cows plus followers had been producing an annual carbon estimate for a beef buyer's program. The first two submissions came back with queries.
The problem was structural. Herd numbers came from a year-end count. Feed was estimated as "roughly what we usually buy." Manure was described as "spread in spring" with no dates. Every number was approximately right and impossible to verify.
The queries cost them time — roughly three weeks of back-and-forth per cycle, chasing invoices and trying to reconstruct when animals moved. Worse, the buyer's per-head premium for verified low-carbon supply was held pending clean data.
The fix wasn't complicated. They started logging herd events as they happened — every birth, death, sale, and purchase dated. They filed feed delivery tickets and matched them to ration periods. Manure application dates went into a log by field. Forage got tested once per cutting instead of assumed.
The next reporting cycle assembled in about two days. The emissions figure actually came in slightly lower than their prior estimate — their earlier averaging had overstated intake for a group sold in spring, inflating the number against their own interest. Buyer queries dropped to zero, the held premium came through, and they got back the weeks of reconstruction they'd been burning every year.
The lesson wasn't that they needed better science. Their formulas were fine. They needed their records to carry dates and corroboration so the numbers could stand on their own.
Where a connected system earns its keep
The manual version of all this works. Plenty of operations run it with disciplined spreadsheets and a well-organized filing cabinet. But it gets fragile in three predictable places.
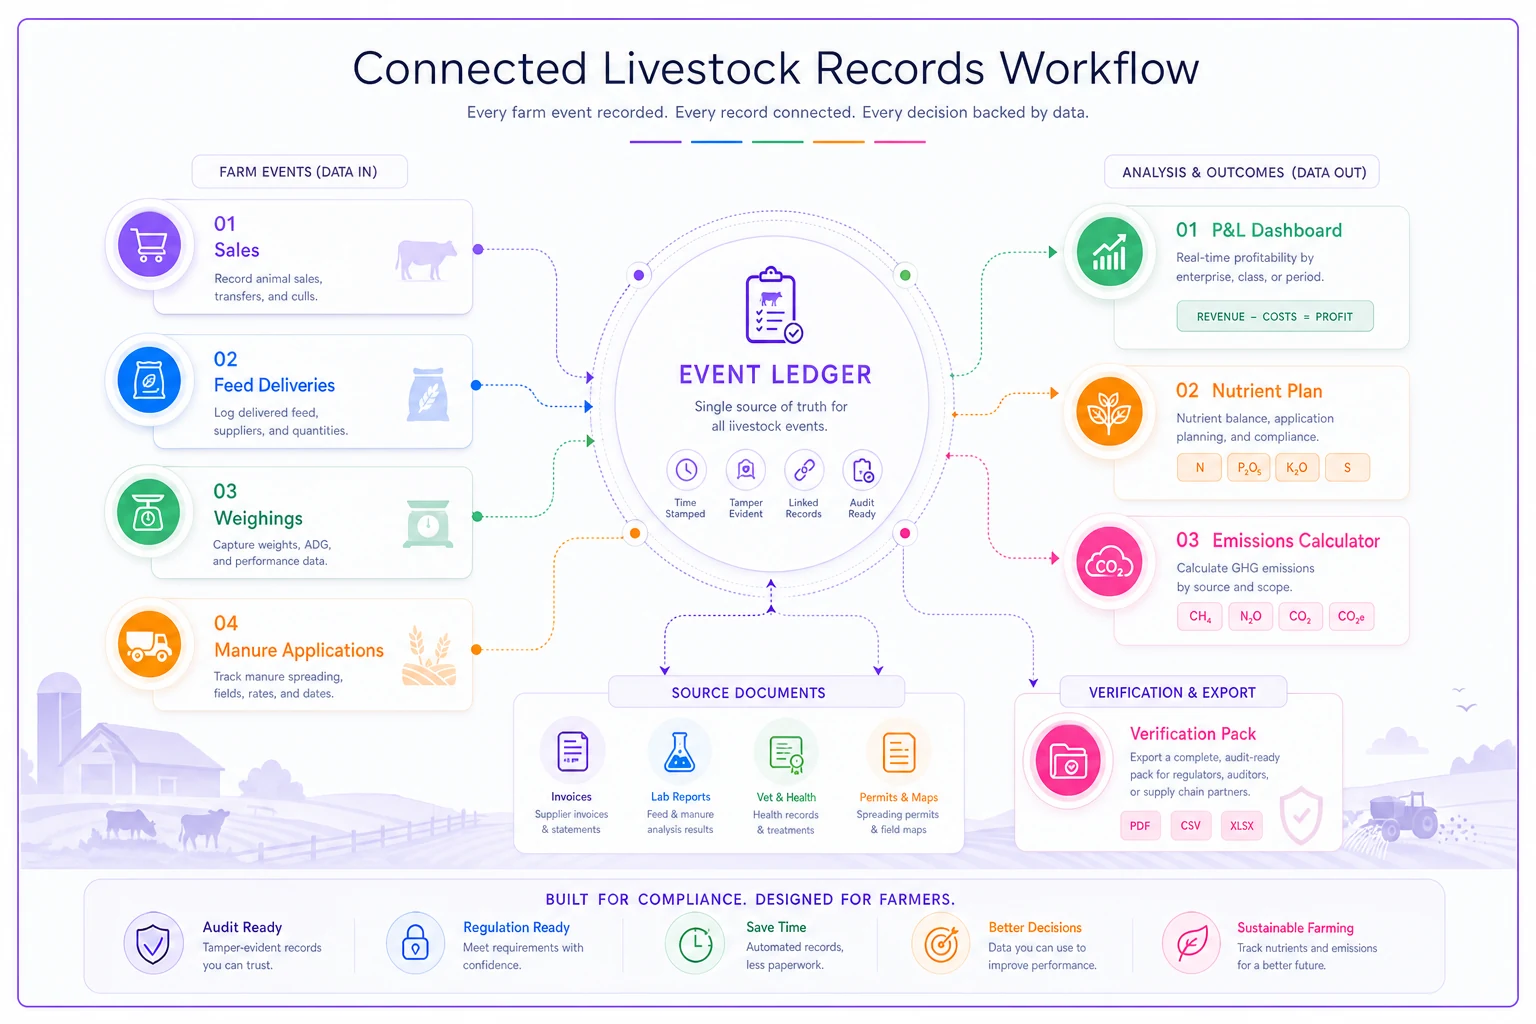
When events and calculations live in separate places, every reporting cycle is a re-entry exercise. You copy animal numbers from the herd book into the carbon spreadsheet, feed totals from invoices into another tab, and each copy is a chance for a transcription error a verifier will find. AI-assisted operational software helps here by letting the same dated event — a sale, a feed delivery, a manure application — feed the P&L, the nutrient plan, and the emissions calculation without anyone re-typing it.
A connected workflow where the same dated event feeds P&L, nutrient plan, and emissions calculation avoids re-entry and speeds verification.
Some of these same feed and intake figures also drive cost planning, so tying your carbon inputs to the same records behind your seasonal feed budgets means one set of numbers serves both purposes instead of two parallel efforts.
When this level of rigor makes sense — and when it doesn't
Worth building out fully if you're selling into a program with verified-carbon premiums, facing buyer or regulatory reporting requirements, or large enough that a data error carries real financial weight. At scale, the reconstruction cost alone justifies the discipline.
Probably overkill if no buyer is asking for it, there's no premium tied to it, and you're small enough that a once-a-year estimate serves your own management needs. Don't build a verification-ready system for an audience that doesn't exist yet — but do keep your event logs clean, because clean records are cheap to maintain and expensive to reconstruct.
A bad idea to chase precision your data can't support. If your feed quality is genuinely unknown, a documented conservative assumption beats a false-precision number that collapses under a single question. Verifiers respect honest boundaries far more than suspiciously exact figures with no source behind them.
The bigger point
Carbon accounting isn't a separate program bolted onto your operation. It's a reading of records you already keep — feed, manure, headcounts, application logs — through a specific lens. The operations that struggle are the ones treating it as an annual research project. The ones that breeze through verification are the ones whose daily records already carry the dates and corroboration that make every number traceable.
Build the record discipline once, and enteric methane, manure emissions, and applied-N nitrous oxide all fall out of the same event stream that runs your feed costs, your nutrient plan, and your P&L. The reporting stops being a scramble and becomes an export. Not more data — just the same data, logged cleanly enough to defend.
Ready to optimize your farm management?
Join hundreds of farmers using Barnyly to save time, improve animal health, and increase farm productivity.